Working with Cases 
![]() Learn more at Stellar Cyber Academy.
Learn more at Stellar Cyber Academy.
The following links take you to courses on the Stellar Cyber Academy technical training portal where you can learn more about this topic by watching the suggested lessons.
Learn to use case views, including the Top Cases, Case Table, and Kill Chain views, to prioritize and manage investigations. Explore how Stellar Cyber automatically correlates related events into cases, enhancing efficiency and providing a comprehensive picture for triaging high-risk incidents.
Watch a demonstration on interacting with cases in the Stellar Cyber UI. Learn to filter, sort, and explore cases, focusing on using the Top Cases view and other filtering options to facilitate investigation workflows.
See how to investigate a case using the UI tools in Stellar Cyber, including detailed analysis options and visualizations. Learn how to track the progression of an attack across different kill chain stages and use available resources to gain insights into security incidents.
Explore workflow tools within the Stellar Cyber UI, including case management, knowledge sharing, task assignment, and alert triage. Discover ways to enhance collaboration, automate notifications, and integrate the UI tools into efficient SOC workflows.
Get familiar with built-in investigation views within the Stellar Cyber Platform, such as case views, alerts, and kill chain views. Learn how to prioritize and sort cases and alerts for effective triage, using these views to drive incident response.
Dive into practical considerations for creating workflows, including best practices for workflow consistency and efficiency. Explore tips for building workflows that adapt to real-world security operations and SOC needs.
Watch a step-by-step investigation of a case in the Stellar Cyber Platform. Follow an example case from start to finish, seeing how to apply tools and techniques to build a cohesive incident narrative.
Continue the case investigation with a focus on detailed analysis and evidence gathering. Learn how to enrich cases with context from different stages in the kill chain for a more comprehensive investigation.
See how to apply filters and search functions in Case Management to locate cases by assigned analyst, alert status, or severity. Use these tools to track open cases and prioritize response actions efficiently.
The first time you access a link on the portal during a session, you must log in to access content.
The Cases view lets you manage cases generated by Stellar Cyber. A case is a set of multiple correlated alerts and entities constituting a potential unified security attack, ranked by a dynamically updated score indicating the severity of the attack. Stellar Cyber uses its machine-learning capabilities to generate cases automatically, grouping related alerts into a unified case for improved attack resolution. In addition, you can also create your own cases from any table that includes alerts (for example, Threat Hunting or Dashboards | PREDEFINED | Analyst View).
Cases offer the following benefits:
-
Streamlined workflows matching standard security analyst procedures.
-
Enact case-specific responses recommended by Stellar Cyber (for example, blocking an IP address) directly within the Case interface.
-
Evidence Locker lets you store emails, PDFs, CSV files, and links to bolster your case.
-
Full export capabilities let you share cases with executive staff.
-
Case Activity log tracks all events related to a case, providing a detailed audit trail.
-
Optional integration with ServiceNow lets you use Stellar Cyber cases and alerts together with your existing help desk and ticket management solution.
Cases evolve in real time as new alerts are discovered and associated with an attack, either automatically by machine learning or manually by a user. You can use Cases as part of your standard SOC workflows to direct a proactive response to ongoing security issues, ensuring they are assessed, assigned, tracked, and resolved.
This article covers the following subjects pertaining to cases in Stellar Cyber:
Refer to Understanding Cases for a detailed discussion of how cases are created and correlated.
Introducing the Cases Display
The Cases display consists of the following main components:
-
Case Dashboard – The Case Dashboard is at the top of the Cases display and includes high-level charts that help you understand the overarching status of all cases passing the current filters.
-
Current Cases Table – The Current Cases table is below the Case Dashboard and provides a sortable table of all cases passing the current display filters with customizable columns. You can select any case to drill to its detail page. You can also use the filters at the left of the page to focus your work on cases that meet specified criteria.
-
Active InSyncs – Active InSyncs appear as separate icons above the Case Dashboard, as illustrated below. An InSync is an "integration synchronization" between Stellar Cyber and a third-party help desk or ticket management system, such as ServiceNow. InSyncs provide bidirectional exchange of alerts and cases between Stellar Cyber and the third-party application.
InSyncs are not available for all customers yet. See Early Access Program Features and Topics Under Development.
The figure below illustrates the organization of the Cases Display:
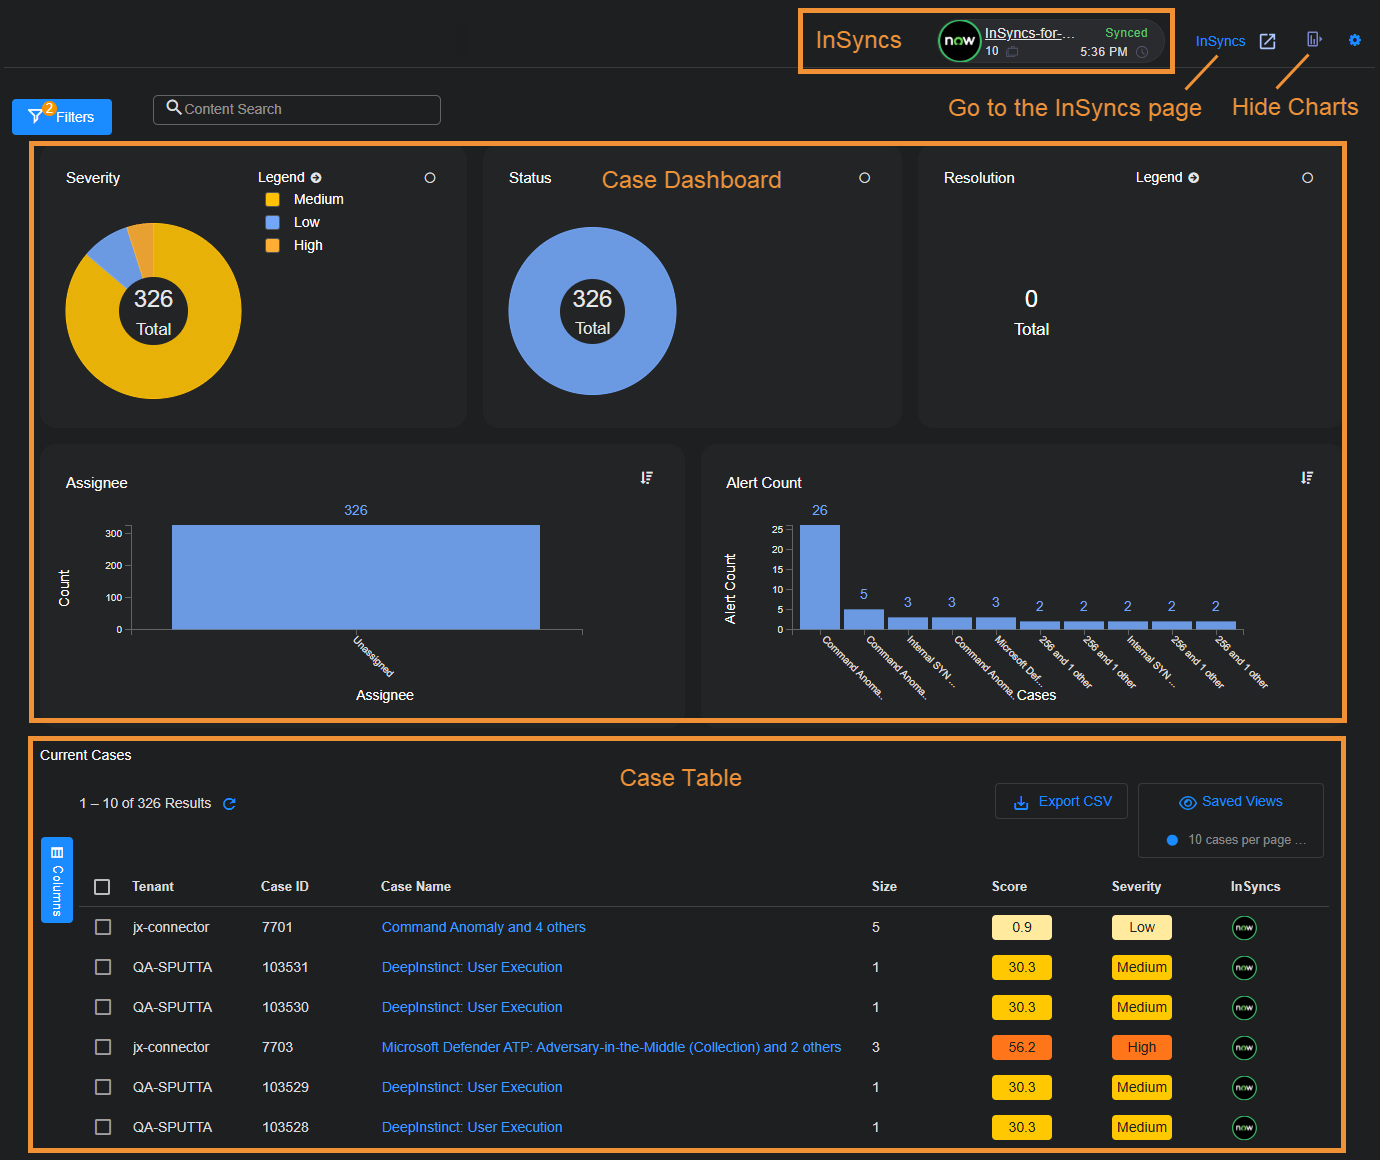
Using the Case Dashboard
High-level charts at the top of the Case display let you see the following information at a glance:
-
Cases by Severity
-
Cases by Status
-
Cases by Resolution

-
Cases by Assignee
-
Cases by Alert Count
Circular charts (Severity, Status, and Resolution) can be viewed in either donut or pie mode using the controls at the top right of the individual charts and are color-coded using the supplied legend. Bar charts (Assignee and Alert Count) can be viewed in either horizontal or vertical mode using the controls at the top right of the individual charts.
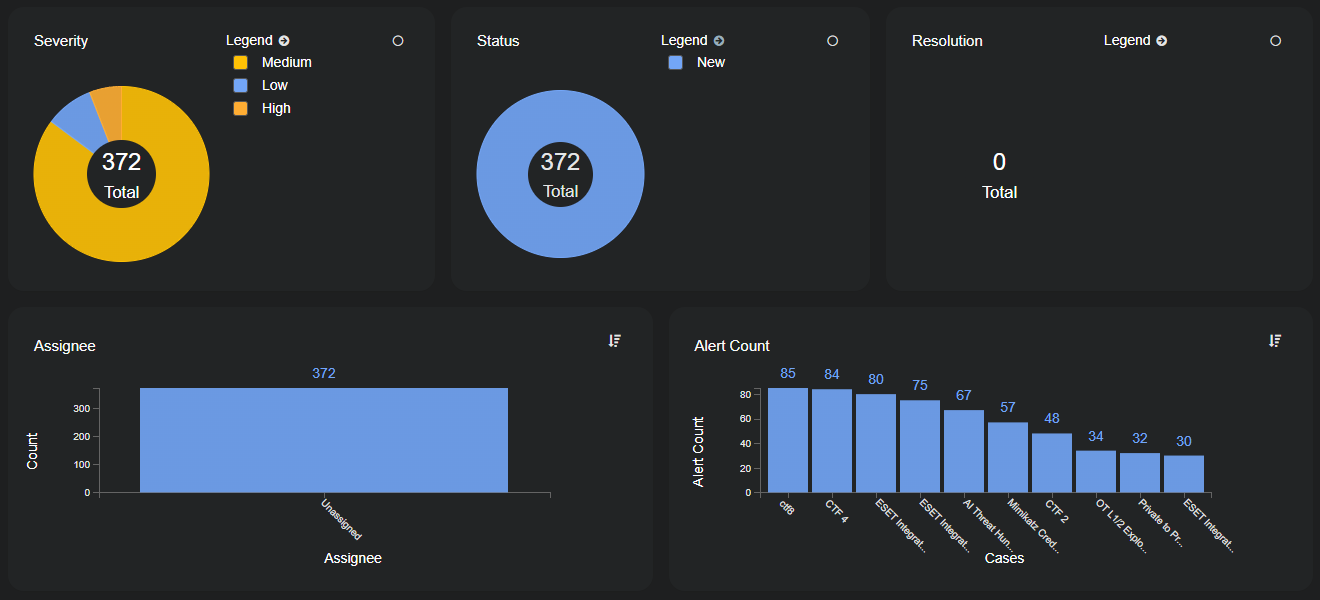
Keep in mind that charts only display data for those cases passing the current case filters. If, for example, you set a case filter that limits the display to just those cases with a Severity of High, similarly, the Cases by Severity chart only shows cases with a Severity of High.
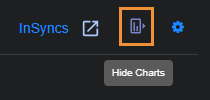
Toggling the Case Dashboard Open and Closed 
The Case Dashboard is displayed by default, but you can toggle it closed to optimize your available screen space with the button at the upper right of the Cases view:
InSync Indicators in the Cases Page 
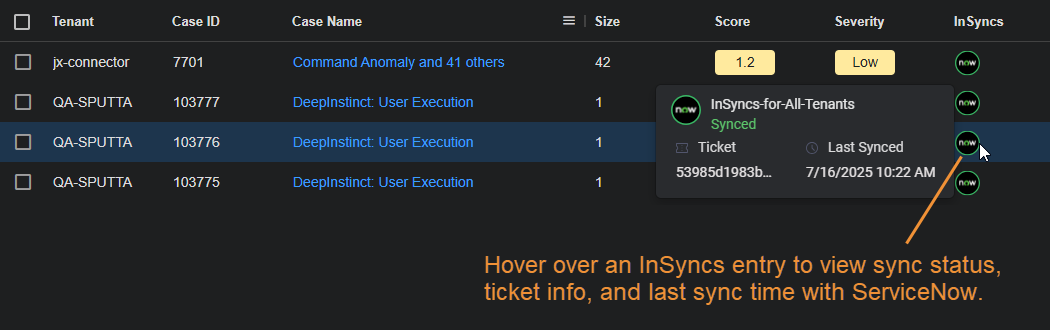
If there are any InSyncs configured, they appear as separate indicators at the top of the Cases page with high level status indicators for the health of the sync. In addition, there is also an InSyncs button that you can select to navigate to the InSyncs page where the integrations are configured. For example:

An InSync is an "integration synchronization" between Stellar Cyber and a third-party help desk or ticket management system, such as ServiceNow. InSyncs provide bidirectional exchange of alerts and cases between Stellar Cyber and the third-party application. Once an InSync is in place, changes made to an alert or case on one side of the InSync are reflected on the other; for example, if you change the name of a synced case in Stellar Cyber, the name change is also reflected in the synchronized table in ServiceNow.
InSyncs are not available for all customers yet. See Early Access Program Features and Topics Under Development.
The screen capture above shows an indicator for an InSync integration with ServiceNow containing the following information:
-
Name – The indicator shows the name of the InSync, as configured on the InSyncs page. Select the InSync name to navigate to the InSyncs page.
-
InSync Status – The status of the InSync is indicated both with text and the color of the circle around the NOW icon:
-
A green circle indicates a Synced status.
-
A gray circle indicates a Paused status.
-
A red circle indicates an Error status.
-
-
Case Count – There is a count of the number of cases that have been synced using this InSync.
If the synced case count is less than the total number of cases shown in the Current Cases table, you probably have a display filter set that is limiting the number of cases displayed. You can use the tools under the Filters icon at the top left of the page to adjust your display filters, if you like.
-
Timestamp – Each indicator includes a timestamp of the last synchronization, expressed in the time zone of the browser.
See Using InSyncs for more information on working with InSyncs.
Using the Current Cases Table
Cases are initially shown in a sortable table with customizable columns. You can select any case to drill to its detail page. You can also use the filters at the left of the page to focus your work on cases that meet specified criteria.
The tabular view lists each case on its own row with the following default columns:
-
Tenant – The tenant with which this case is associated.
-
Case ID – The system-assigned number for the case.
-
Case Name – Stellar Cyber automatically assigns a name to each case it reports. You can either accept the default name or supply your own in the Case Detail view.
-
Score – Stellar Cyber assigns scores to cases based on how critical they are. A case's score updates in real time as events and entities are added to or removed from the case. Scores are color-coded to indicate the seriousness of the case.
-
Severity – The severity of the case (Critical, High, Medium, or Low). Severity automatically changes with a case's score until it is changed manually in the Case Detail view. Once you manually edit a case's severity, it no longer updates automatically based on the case score. Severity indicators are color-coded to direct your attention to more serious cases.
-
Creator – The user account that created the case. Cases created by Stellar Cyber are listed with a creator of System.
-
What – The Tactic or Technique for the alert with the highest severity associated with this case.
-
Who – The users and hosts associated with the case. You can find details on the observables for the case in the Analysis tab on the Case Detail page.
-
Assignee – The assignee for the case, if any. Cases can be assigned to resources in the Case Detail view or by selecting the check box for a case at the left of the table and using the bulk edit controls that appear at the top of the table.
Working with the Current Cases Table
The Current Cases table supports standard Stellar Cyber table functionality. You can change the columns in the Current Cases table by selecting the vertical Columns button at the left of the table to toggle open a panel where you can choose the columns to display.
You can add any of the following additional columns:
-
Acknowledged At – The time at which the case was acknowledged. A case is considered acknowledged when a user makes a change to its Severity, Status, or Assignment.
-
Size – The number of alerts associated with the case.
A case can have a maximum of 5,000 associated alerts.
-
Closed At – The time at which the case was closed. Cases are closed when their status is set to either Resolved or Cancelled.
-
Created At – The time at which the case was created.
-
InSyncs
– For cases that are synchronized with an associated ServiceNow installation using an InSync, you can hover over mouse over the NOW icon in the InSyncs column and see the following information on the synchronization for the case:-
The name of the InSync performing the synchronization between Stellar Cyber and a third-party application such as ServiceNow.
-
The status of the InSync (Synced, Paused, or Error).
-
The ticket number for the synchronized case in ServiceNow.
-
The last time the case was synchronized, expressed in the time zone of the browser.
-
-
Last Modified – The last time the case was modified. A case is considered to have been modified whenever there are changes to its alerts, severity, status, comments, or evidence.
-
Modified By – The user account that last modified the case.
-
Status – The status associated with this case. This can be either New, In Progress, Resolved, Cancelled, or Escalated. Changing the status of a case helps you track your team's response to it over time. You can change a the status in the Case Detail view or by selecting the check box for a case at the left of the table and using the bulk edit controls that appear at the top of the table.
-
Tags – The tags assigned to the case, if any. You can assign tags to a case in the Case Detail view or by selecting the check box for a case at the left of the table and using the bulk edit controls that appear at the top of the table.
-
Resolution – The resolution given to a case when its status was set to Resolved. Resolutions can be None, False Positive, Benign, or True Positive. The default is None. See Suggested Usage for the Case Resolution Tags for more information on the available resolution tags.
Not All Columns Supported for Sorting
-
Assignee
-
Tenant
-
Creator
-
Modified By
-
Tags
-
Who
-
What
Filtering the Display of Cases
The Cases page includes a Filters panel that lets you focus the display on just those cases matching the criteria you supply. By default, you can filter the Cases page by Score, Severity, Assignee, Created At date, Last Modified date, Status, or Tags. You can also use the Add new filter feature to add filters based on the same criteria available as columns for the Current Cases table.
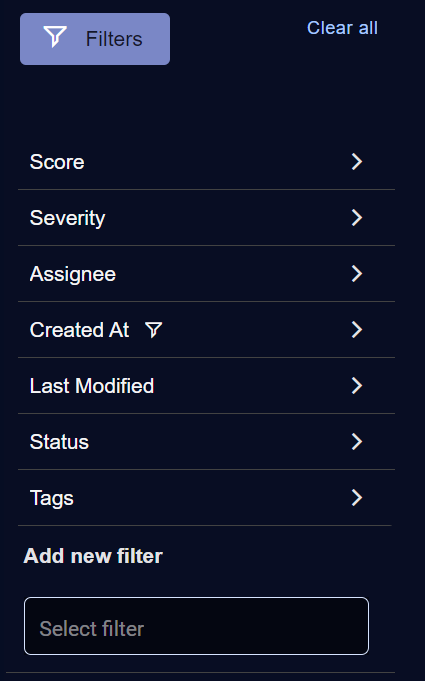
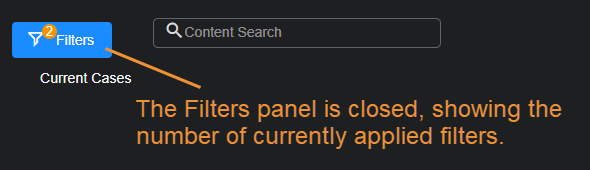
The Filters panel indicates which filters are currently applied with a special  icon in the entry for each filter type. For example, in the figure above, we can see that there is currently a Created At filter applied. Similarly, when the Filters panel is cascaded closed, its entry updates to show the total filters applied, as in the example below.
Use the following filters to control the information that's displayed:
-
Score – Use the slider bar to specify the range of case scores from 0-100 to display.
-
Severity – Check one or more of the boxes for the case priorities to display (Critical, High, Medium, and Low).
-
Assignee – Start typing in the Search field to see a list of matching user accounts that can be selected as a filter or choose one of the listed users. Users only appear for selection if they have the Edit Cases privilege assigned in Role-Based Access Control and belong to the logged-in tenant. You can select multiple users for the filter.
-
Created At – Use the date controls to specify a range for the creation dates of the cases to display.
By default, the Created At filter is automatically set to the last 24 hours. If you select Clear All, the Created At filter resets to the last 24 hours. You can set a range manually if you need a larger range.

-
Last Modified – Use the date controls to specify a range for the modification dates of the cases to display. Modifications include changes to the alerts, severity, status, comments, or evidence of a case.
The dates you specify for both the Created and Last Modified filters are specified in terms of the browser's local time zone.
-
Status – Select one or more case statuses to display: Escalated, New, In Progress, Resolved, and Cancelled.
By default, the Cases page has the Escalated, New, and In Progress Status filters enabled. You can deselect these filters and/or add additional Status filters. However, if you clear all the Status filters, the page automatically enables the default Escalated, New, and In Progress filters again.
-
Tags – Start typing in the Search field to see a list of matching tags that can be selected as a filter or choose one of the listed tags. You can select multiple tags for the filter.
Searching the Current Cases Table
The Current Cases table includes a Search tool at the top of the display that lets you perform a text-based search using Lucene syntax for a specified value. Keep in mind the following when searching Cases:
-
The data returned by the search is limited to just those entries that pass the current Case filters.
-
The search is performed across all available pages of cases, not just the currently displayed page. For example, if there are three pages of 20 cases available in the Current Cases table, matches can be found on any of the three available pages, regardless of the sort order.
Not All Fields Supported for Searching
-
Assignee
-
Tenant
-
Creator
-
Modified By
-
Who
-
What
Performing Bulk Actions in the Current Cases Table
The Current Cases table supports bulk edits to the Status, Tags, or Assignee of multiple cases. Use the following procedure:
-
Select one or more cases in the Current Cases table by checking their boxes at the left of the table.
New Bulk Edit controls appear at the top of the table, as illustrated below:
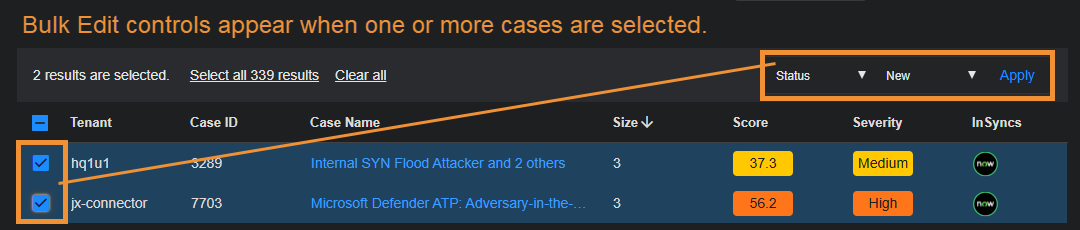
-
Select the type of Bulk Action want to perform from the dropdown:
-
Status – The adjacent dropdown lets you select any of the standard Case statuses (Escalated, New, In Progress, Resolved, or Cancelled).
Once the status of a case has been changed to either Resolved or Cancelled, Stellar Cyber no longer associates new alerts with it. Instead, new alerts are either used to create a new case or associated with a different open case.
-
Tags – The adjacent dropdown lets you select from any existing tags. You can also type in a new tag.
-
Assignee – The adjacent dropdown lets you select any existing user available to your tenancy.
-
-
Select Apply to apply your bulk action to the selected cases.
Keeping Track of Bulk Actions
Once you apply a bulk action to one or more cases, Stellar Cyber displays a success or failure message at the top of the display and keeps track of its progress in the Task List.
Here's an example of a Bulk Action that was successfully applied:

You can display the Task List using its icon at the top of the display, as illustrated below. The Task List keeps track of the progress, success, or failure of any bulk actions performed from the Current Cases table, as well as any other ongoing Stellar Cyber activities. Depending on the number of cases affected by a bulk action, it make take a few seconds for the action to complete. The Task List is useful in these situations, letting you see the progress of the action. Here's how you display the Task List, complete with some successful bulk actions:
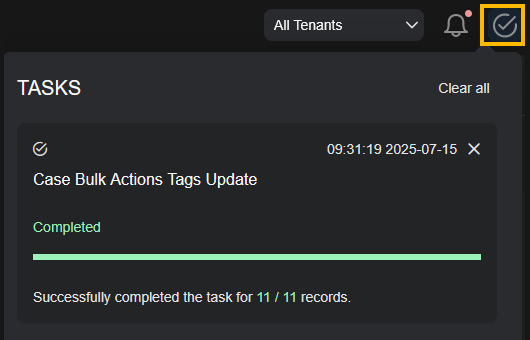
You can clear individual tasks from the list using the standard close button at the upper right of their entries in the list. Clear all of the tasks using the Clear all link at the top of the list.
Standard Functionality in the Current Cases Table
The Current Cases Table offers standard table functionality, including the ability to sort on a column, pin columns, autosize columns, reset column sizes, Export as CSV, or Change Columns.
Changing Case Settings
Users with a root user scope and RBAC privileges to change user interface settings can select the Settings  icon at the upper right of the Cases page and make global changes that affect all cases. Case Settings include options for controlling visibility (Case Properties), case alert correlation behavior (Correlation), and case suppression logic (Case Filters).
Setting Case Properties
Use the Case Properties settings to control which case elements are visible to partner and tenant users, and whether related alerts are automatically closed when a case is resolved or cancelled. These settings apply globally and are only available to users with root scope.
Hide Assignee/Hide Comments
The Hide Assignee and Hide Comments options let root users specify whether partner and tenant users can see case assignees and comments:
-
Hide Assignee – Hide case assignees from partner and tenant users.
-
Hide Comments – Hide case comments from partner and tenant users.
Users with root scope can still see case assignees and comments regardless of the settings of these options.
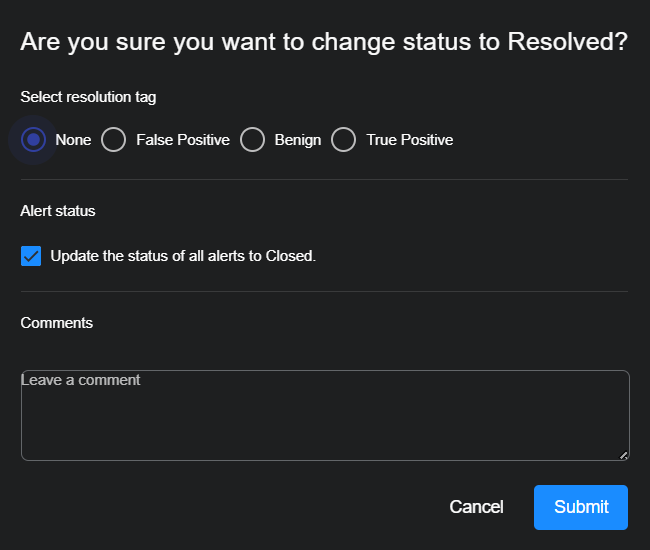
Close All Related Alerts 
This option specifies whether all alerts related to a case are closed by default when the parent case's status changes to either Resolved or Cancelled. Alerts in cases closed through the API or InSyncs are also closed automatically when this option is enabled.
You can override this default setting for individual cases in the confirmation dialog box that appears when cancelling or resolving a case. The Update the status of all alerts to Closed option is automatically set according to whatever you specify for this global default, but you can reverse the setting in the confirmation dialog for an individual case, as illustrated below:
Setting the Correlation Timeout
The Correlation Properties settings let you set a global Correlation Timeout for your organization. The Correlation Timeout specifies the time window within which new alerts are considered for correlation into both new and currently open cases.
An alert can be correlated into an existing case if it occurs within a specific time window of the case. This time window is determined by Correlation Timeout, which is the amount of time that has passed after the latest alert that was correlated into the case or before its earliest correlated alert. The figure below illustrates how this works:
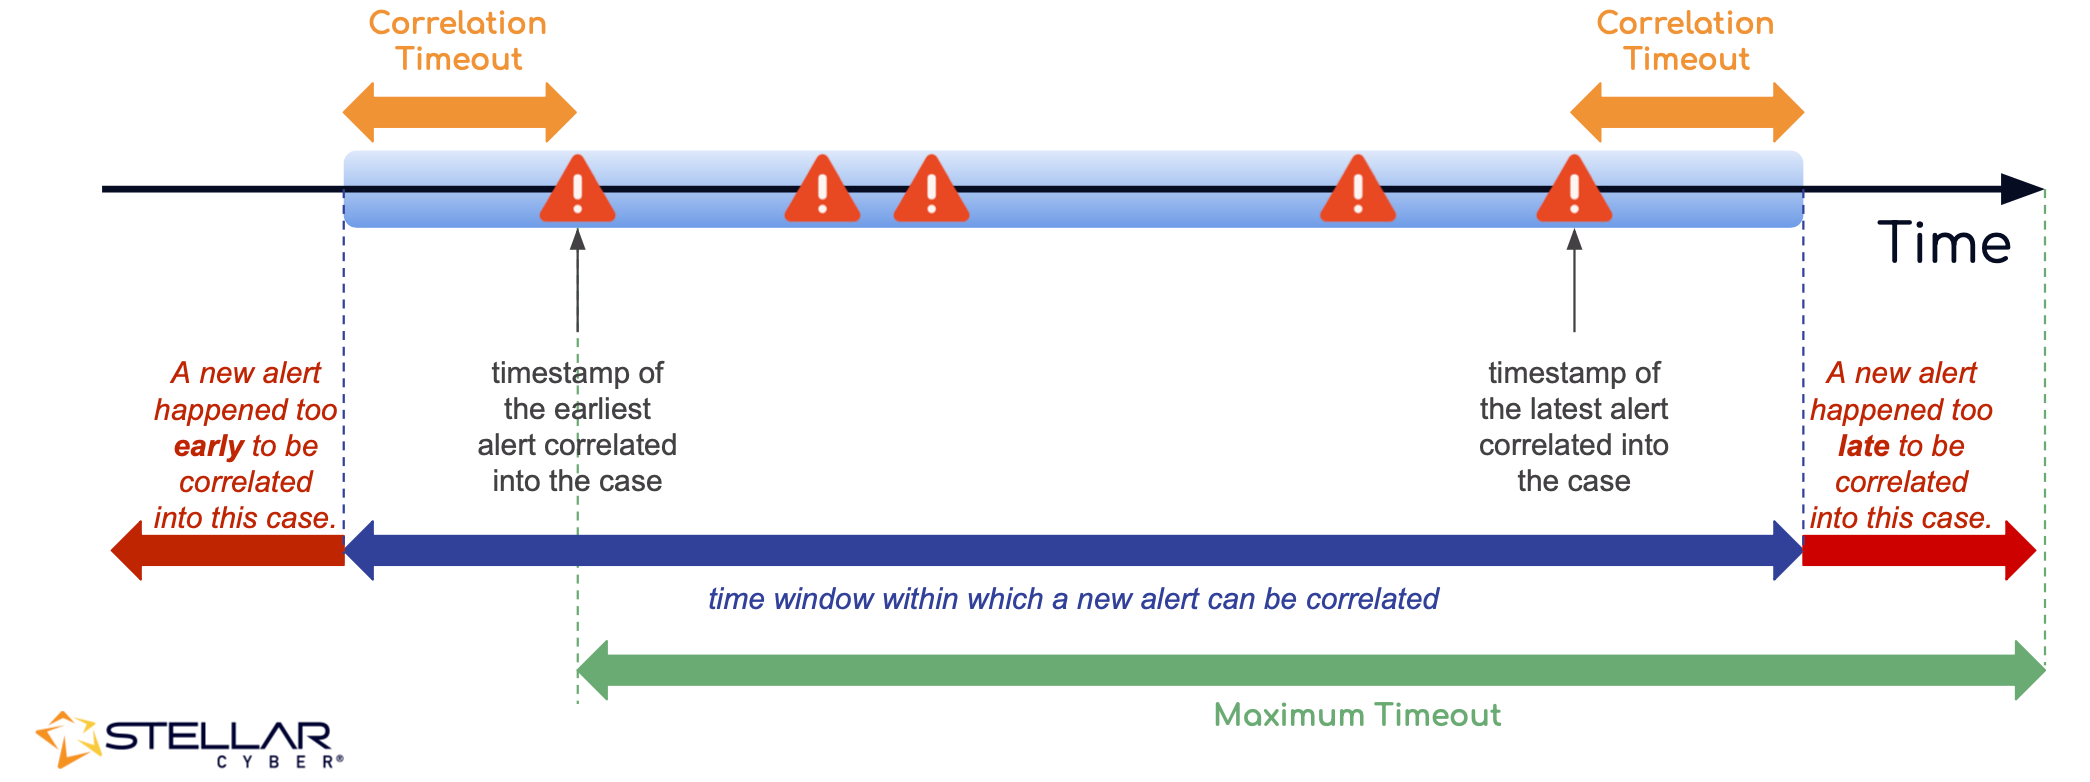
As summarized in the figure above:
-
A new alert is not considered for correlation if it occurs after the amount of time specified by the Correlation Timeout has passed since the last correlated alert for the case. An alert such as this has occurred too late for correlation.
-
A new alert is not considered for correlation if it occurs earlier than the amount of time specified by the Correlation Timeout before the earliest alert associated with the case. An alert such as this has occurred too early for correlation into the case.
The default Correlation Timeout is three hours; the maximum is 24 hours.
Use the drop-down lists to specify the Correlation Timeout for your organization in hours and minutes. The user interface does not let you specify a value greater than 24 hours. You can always use the Reset to default option to restore the default value.
Changes to the Correlation Timeout apply only to open and new cases. Closed cases are not updated with additional alerts based on a change to the Correlation Timeout. However, it is possible that a change to the Correlation Timeout can result in additional alerts being correlated to an open case that took place before the previously reported earliest alert.
Refer to Understanding Cases for a detailed discussion of how cases are created and correlated.
Using Case Filters 
You can use case filters to control the automatic creation of cases by defining specific conditions under which Stellar Cyber suppresses their creation. Instead of generating a case for every group of related alerts, you can use case filters to prevent the creation of cases that are low risk, expected, or otherwise unimportant. This reduces case volume and helps you focus attention and resources on the alerts that matter most. This targeted suppression allows your team to maintain a streamlined, relevant case queue and reduce alert fatigue.
In the Case Settings section, you can create new filters, edit existing ones, or delete filters that are no longer needed. For detailed information about case filters, see Using Case Filters and the Filter Builder.
Drilling to the Case Detail Page
You can select a case entry in the Current Cases table to drill to the Case Detail view for the corresponding Case.
Displaying Cases from Event Details
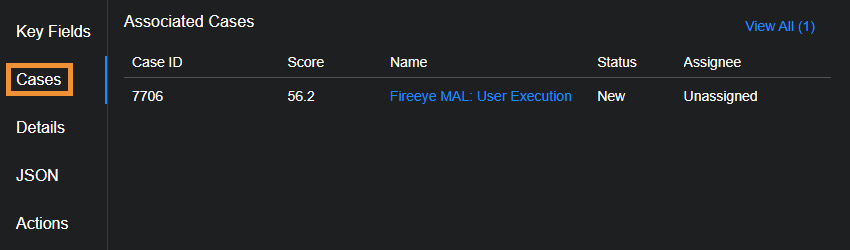
In addition to accessing the Current Cases table from the Cases menu, you can also display a filtered Current Cases table from the Cases list in the Event Details view for an alert.
The Cases list shows cases associated with the selected alert in descending order by score, up to a maximum of five. You can select the View All (x) link at the upper right of the list to open a new tab with a filtered view of the Case summary page showing just those cases associated with the selected alert. You can also select the entry for an individual case in the list to open its associated Case details page. The figure below shows the Cases list from the Event Details view of an alert:
About Case Data Retention
To control the number of stored cases and improve the overall performance of case queries, Stellar Cyber stores a case for a maximum of one year from the time of its last update.
