SLA (Service Level Agreements)
The Visualize | Predefined | SLA page helps you understand how quickly alerts are being triaged in your organization, documenting transitions in alert status according to how long they took to accomplish.
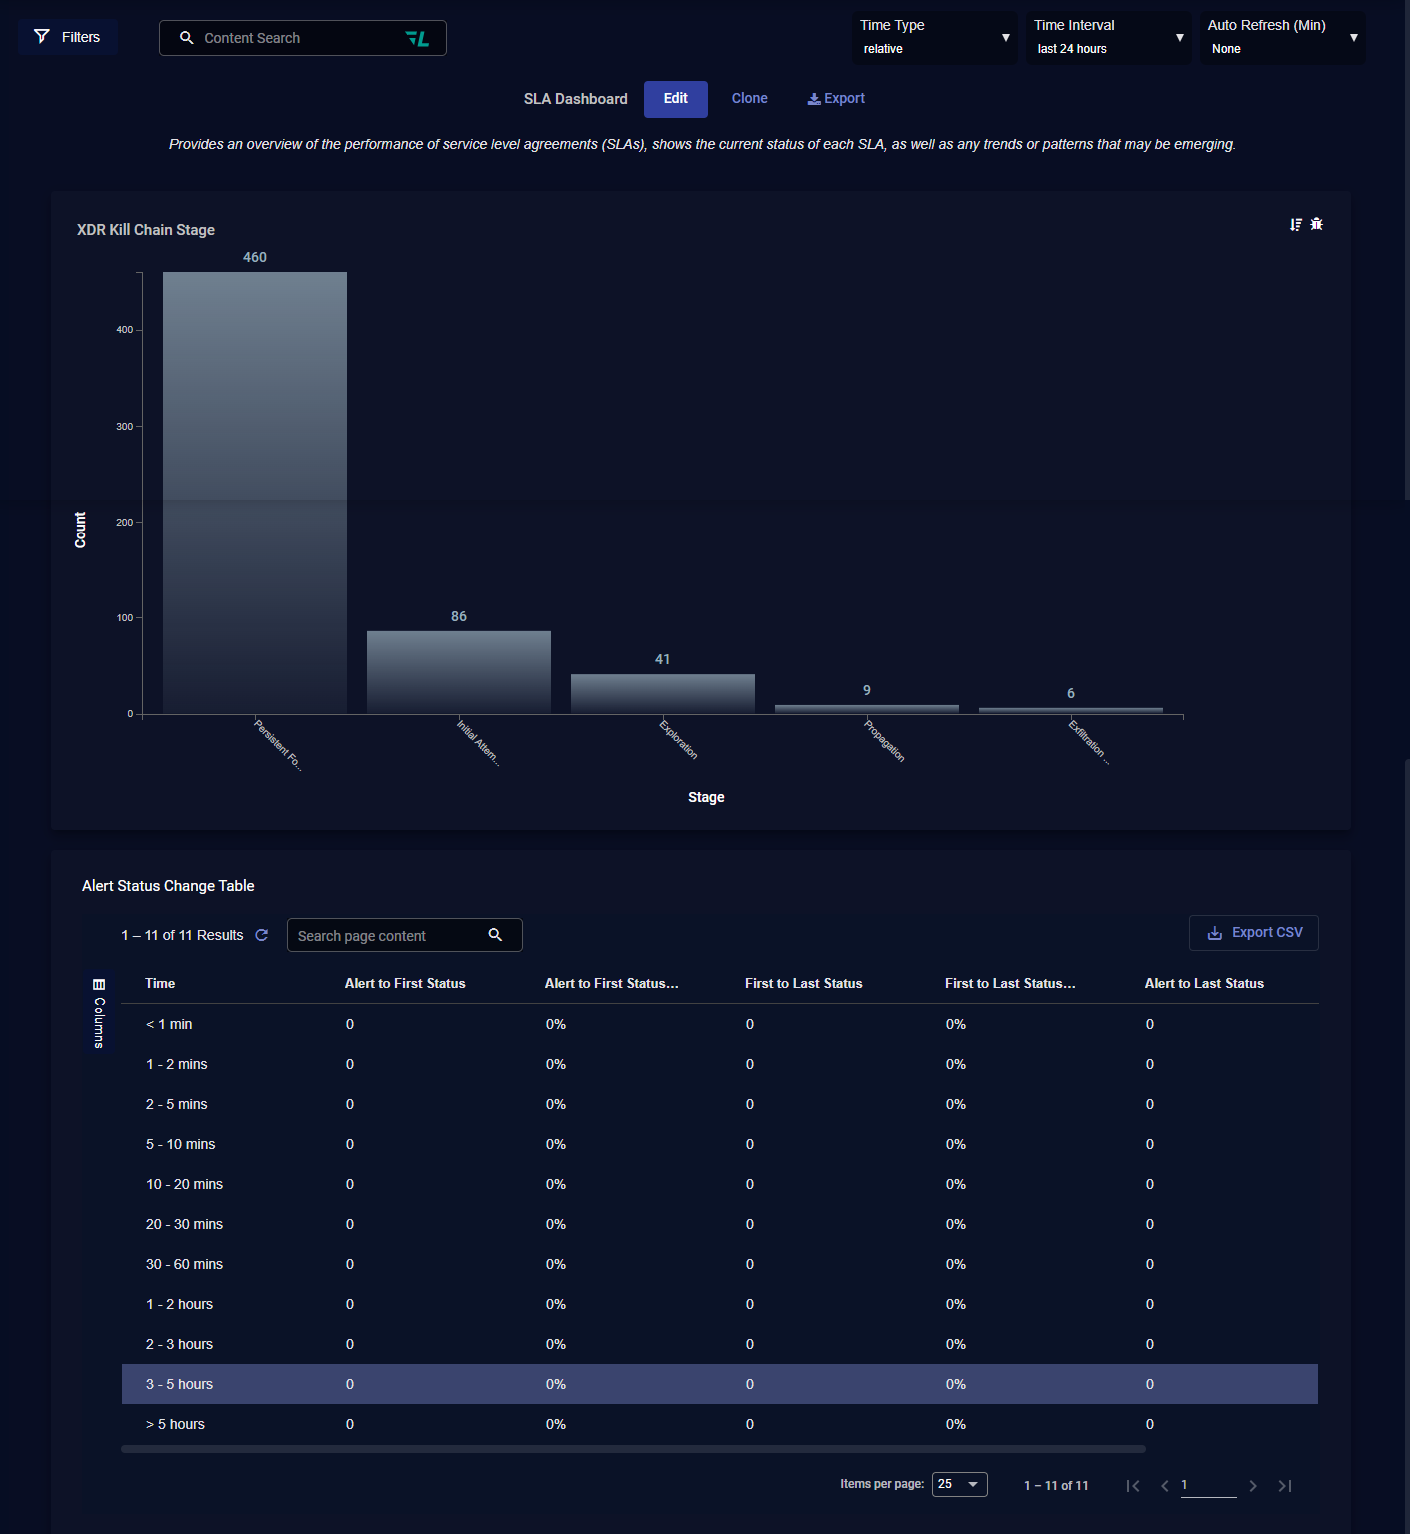
The image below shows an example of the SLA dashboard.
The data in this display includes only raw traffic data that matches the current filter settings. See the Filters page for more information.
By default, the predefined dashboards show All Open alerts. You can use the filters at the left of the dashboard to change which alerts are displayed.
XDR Kill Chain Stage Chart
This section is at the top of the dashboard and shows a bar chart illustrating the number of alerts at each XDR Kill Chain stage in the Time Interval selected at the top of the page..
Alert Status Change Table
The Alert Status Change table shows you how quickly alerts are being triaged and closed in your organization. The table quantifies changes in alert status according to the amount of time taken. For example, you can see the number of alerts whose first change in status took place within 5-10 minutes of the alert being created, or, conversely, after more than five hours had passed. The following changes in alert status are shown by default:
-
Alert to First Status / Alert to First Status Percentage – These two columns show you how quickly alerts are being triaged in your organization, documenting the time taken between when alerts are created and when their first change in status takes place. The first column provides raw counts for each time window (1-2 minutes, 2-5 minutes, and so on) while the second shows the percentage of total alerts in each time window.
-
First to Last Status / First to Last Status Percentage – These two columns show you how quickly alerts are closed in your organization, documenting the time taken between their first status change and their most recent status change. The first column provides raw counts for each time window (1-2 minutes, 2-5 minutes, and so on) while the second shows the percentage of total alerts in each time window.
See the Tables page for more information on working with tables.
