Working with Cases
 Learn more at Stellar Cyber Academy.
The following links take you to courses on the Stellar Cyber Academy technical training portal where you can learn more about a topic by watching the suggested lessons.
 J02 Introduction to Features in the User Interface (02h:24m)
L01A-PRES: Case Views (11m:57s)
J02 Introduction to Features in the User Interface (02h:24m)
L01A-PRES: Case Views (11m:57s)
Learn to use case views, including the Top Cases, Case Table, and Kill Chain views, to prioritize and manage investigations. Explore how Stellar Cyber automatically correlates related events into cases, enhancing efficiency and providing a comprehensive picture for triaging high-risk incidents.
L01B-DEMO: UI Overview with Cases (15m:14s)
Watch a demonstration on interacting with cases in the Stellar Cyber UI. Learn to filter, sort, and explore cases, focusing on using the Top Cases view and other filtering options to facilitate investigation workflows.
L01C-DEMO: Example of Case Investigation Tools (17m:03s)
See how to investigate a case using the UI tools in Stellar Cyber, including detailed analysis options and visualizations. Learn how to track the progression of an attack across different kill chain stages and use available resources to gain insights into security incidents.
J03 Investigations and Workflows (05h:48m)
L02B-DEMO: Workflow Tools in Stellar Cyber UI (32m:45s)
Explore workflow tools within the Stellar Cyber UI, including case management, knowledge sharing, task assignment, and alert triage. Discover ways to enhance collaboration, automate notifications, and integrate the UI tools into efficient SOC workflows.
L03B-DEMO: Built-In Investigation Views (22m:00s)
Get familiar with built-in investigation views within the Stellar Cyber Platform, such as case views, alerts, and kill chain views. Learn how to prioritize and sort cases and alerts for effective triage, using these views to drive incident response.
L06A-PRES: Building Workflows in Stellar Cyber - In Practice (15m:40s)
Dive into practical considerations for creating workflows, including best practices for workflow consistency and efficiency. Explore tips for building workflows that adapt to real-world security operations and SOC needs.
L07B-DEMO: Case Investigation Part 1 (22m:17s)
Watch a step-by-step investigation of a case in the Stellar Cyber Platform. Follow an example case from start to finish, seeing how to apply tools and techniques to build a cohesive incident narrative.
L07C-DEMO: Case Investigation Part 2 (18m:46s)
Continue the case investigation with a focus on detailed analysis and evidence gathering. Learn how to enrich cases with context from different stages in the kill chain for a more comprehensive investigation.
J04 Open XDR Investigation Tools (04h:47m)
L06C-DEMO: Filter and Search Within Case Management (11m:43s)
See how to apply filters and search functions in Case Management to locate cases by assigned analyst, alert status, or severity. Use these tools to track open cases and prioritize response actions efficiently.
The first time you access a link on the portal during a session, you must log in to access content.
The Cases view lets you manage cases generated by Stellar Cyber. A case is a set of multiple correlated alerts and entities constituting a potential unified security attack, ranked by a dynamically updated score indicating the severity of the attack. Stellar Cyber uses its machine-learning capabilities to generate cases automatically, grouping related alerts into a unified case for improved attack resolution. In addition, you can also create your own cases from any table that includes alerts (for example, Threat Hunting or Dashboards | PREDEFINED | Analyst View).
Cases offer the following benefits:
-
Streamlined workflows matching standard security analyst procedures.
-
Enact case-specific responses recommended by Stellar Cyber (for example, blocking an IP address) directly within the Case interface.
-
Use Case Queues to focus the case displays on just those cases matching a specific workflow or role.
-
Evidence Locker lets you store emails, PDFs, CSV files, and links to bolster your case.
-
Full export capabilities let you share cases with executive staff, including AI-generated summaries, if enabled.
-
Case Activity log tracks all events related to a case, providing a detailed audit trail.
-
Optional integration with ServiceNow lets you use Stellar Cyber cases and alerts together with your existing help desk and ticket management solution.
-
When AI Case Analysis is enabled in Global Settings, Stellar Cyber uses AI to add new details to the tabs in the Case Detail view:
-
Case Detail view's Detection tab includes AI-generated summaries once analysis has been run to accelerate investigations.
-
Case Detail view's Analysis tab includes a new Hypothesis panel and adds AI-generated summaries to the existing Timeline, and Observables panels, helping summarize alerts into a case-level story, reconstructing timelines, and explaining relationships between entities.
-
Case Detail view's Response tab provides tailored response recommendations, giving you clear context and next steps without the need to stitch alerts together manually.
-
-
Alert Auto Triage is available through the purchase of an add-on license (a 7-day trial is also offered for evaluation). This feature automatically investigates alerts and assigns verdicts before you review them, helping you focus on the most relevant cases and reduce manual triage effort.
Cases evolve in real time as new alerts are discovered and associated with an attack, either automatically by machine learning or manually by a user. You can use cases as part of your standard SOC workflows to direct a proactive response to ongoing security issues, ensuring they are assessed, assigned, tracked, and resolved.
This article covers the following subjects related to cases in Stellar Cyber:
Refer to Understanding Cases for a detailed discussion of how cases are created and correlated.
Introducing the Cases Display
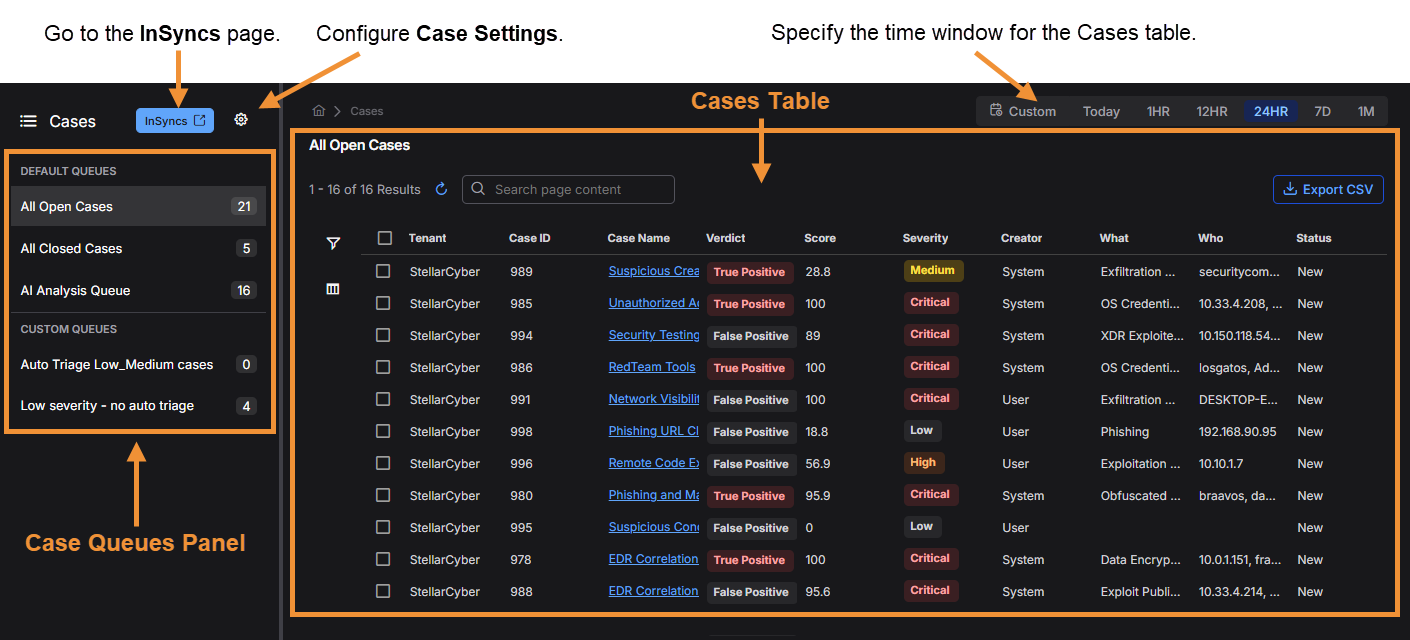
The Cases display consists of the following main components:
-
Case Queues – The Case Queues panel is at the left of the Cases display and lists the configured case queues. A case queue is a display filter that focuses the case displays on just those cases that match specified criteria (tenancy, status, severity, tags, and so on), ensuring that teams see the cases that matter to them without being overwhelmed by those that do not.
-
Cases Table – The Cases table is your starting point for working with cases. It provides a table of all cases in the selected Case Queue and time range with sortable and customizable columns. You can select any case to drill to its detail page. You can also use the filters at the left of the page to focus your work on cases that meet specified criteria.
The figure below illustrates the organization of the Cases display:
Using Case Queues
Case management queues  let you organize cases into logical groups based on configurable rules or manual assignment. Each queue can represent a grouping by tenant, region, severity, SOC team, shift, subject matter expertise, and similar criteria. Analysts are assigned to specific queues and see only the cases within those queues, which reduces noise and helps them focus. A case can appear in multiple queues if it matches the conditions defined for each queue.
Configuring Case Queues
The following procedure describes how to create, define, and manage case queues. These steps are typically performed by administrators who need to segment case visibility and assign cases to analysts or teams based on specific operational requirements.
-
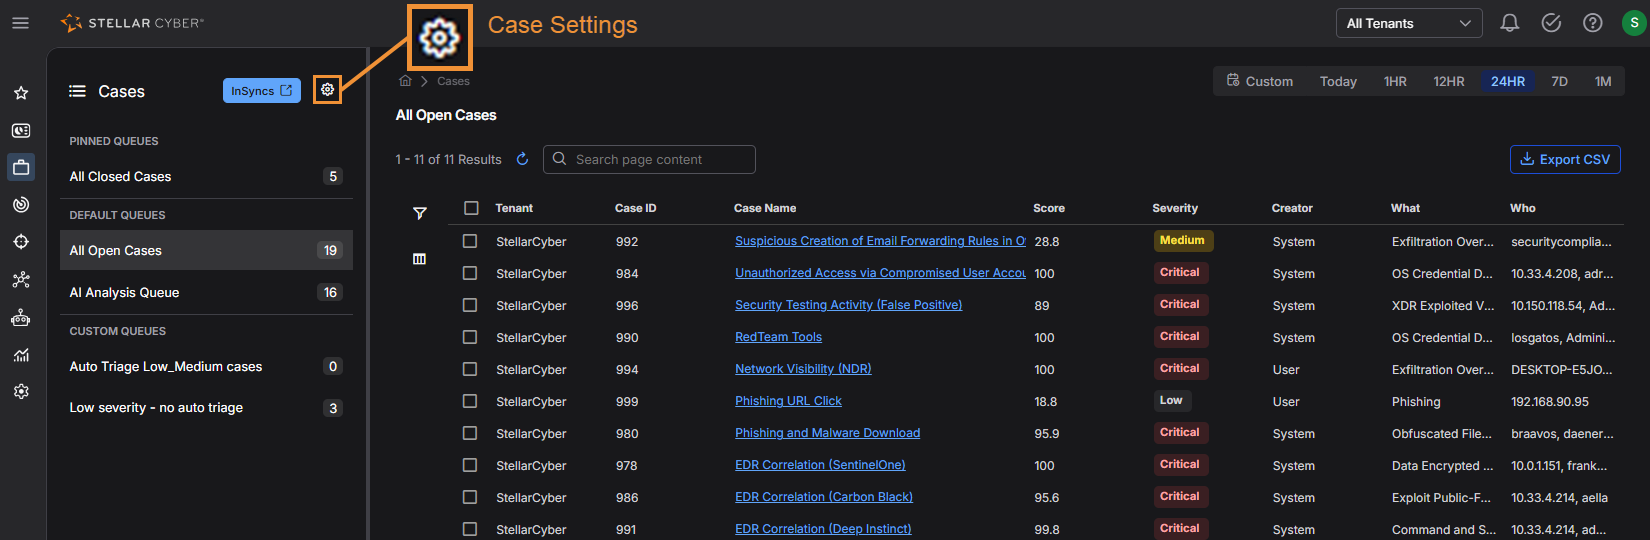
Go to Cases and open the Case Settings panel by selecting the gear icon located near the top of the narrow left panel on the Cases page.
-
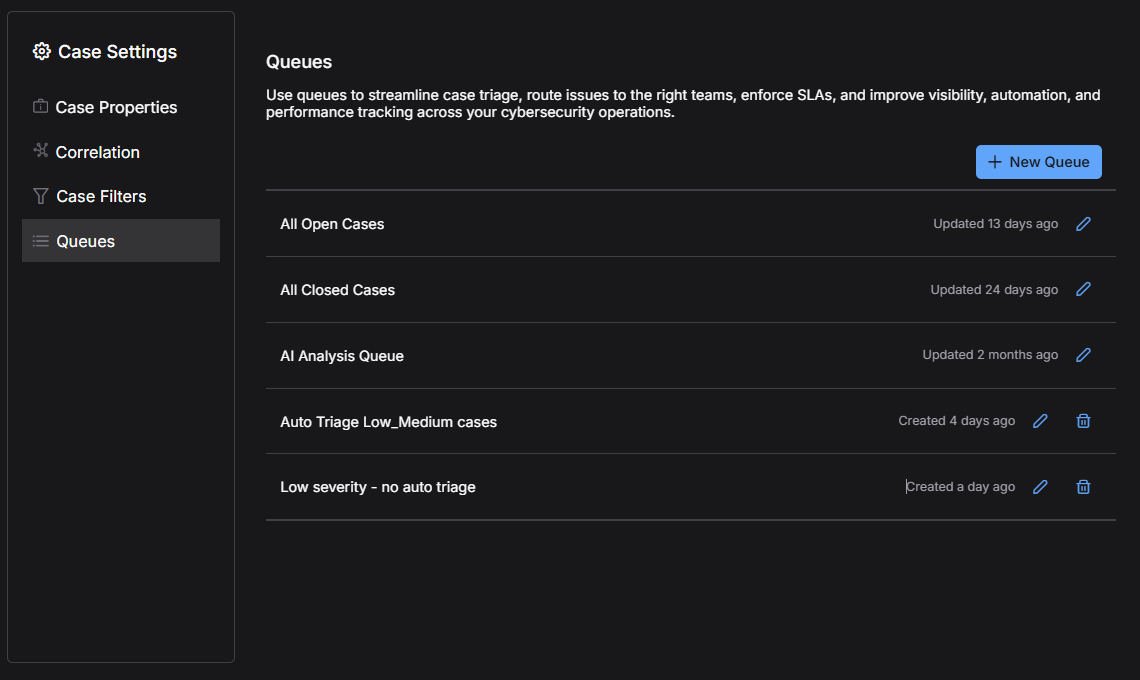
In the Case Settings panel that appears, select the Queues tab and then select New Queue to open the queue builder.
-
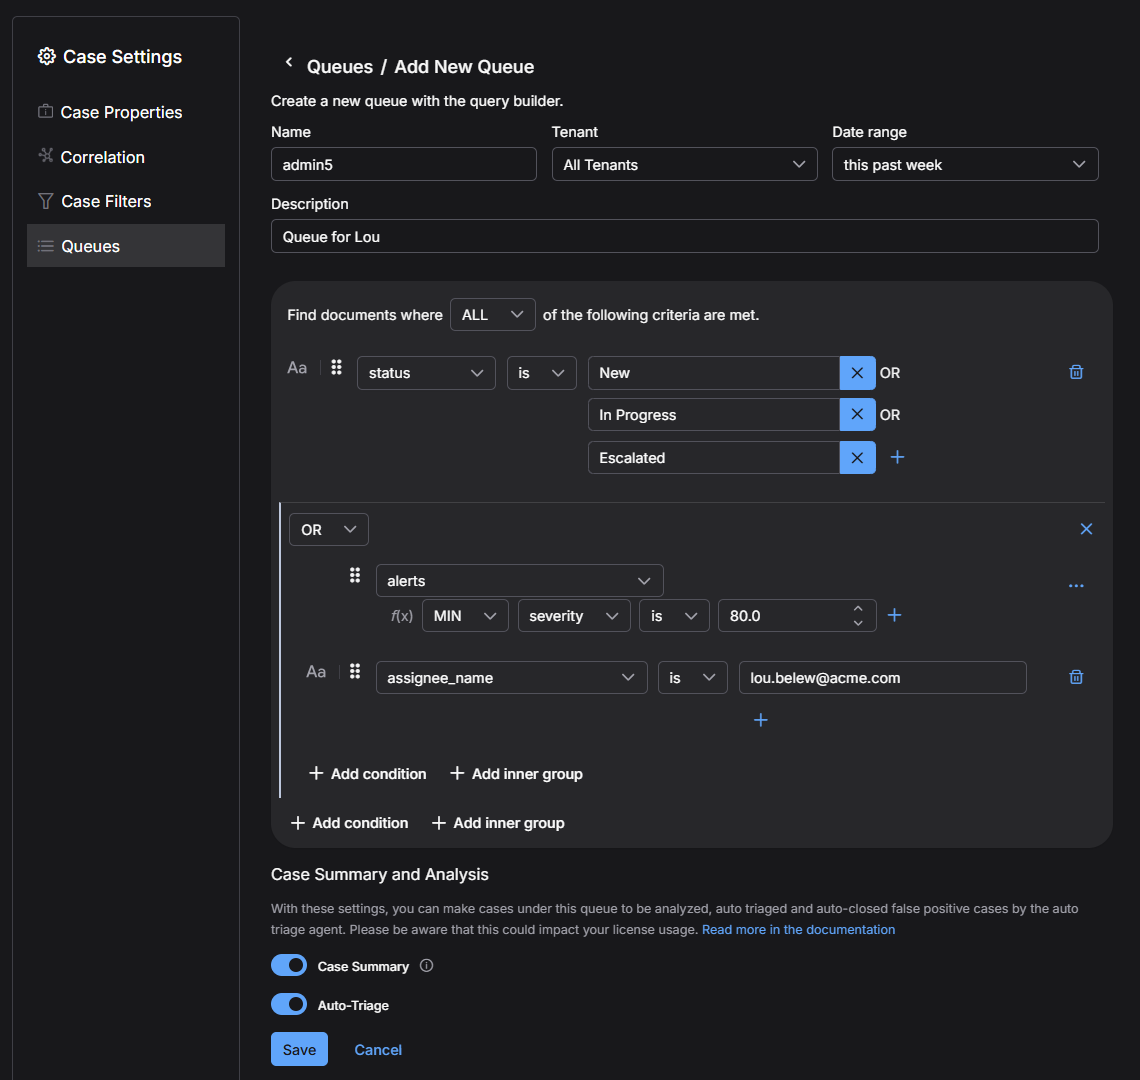
Name the queue, choose the tenant scope and date range to define which cases the queue evaluates, and, optionally, enter a description.
-
For custom queues, the standard date range options extend from last 15 minutes through this past month. The default date range is this past week.
If you require different date ranges than these, contact Stellar Cyber Customer Success.
-
When a queue is created or updated, Stellar Cyber performs re-indexing, which means it re-evaluates all existing cases in the selected time frame to determine which ones match the defined conditions. Selecting a longer time range increases the number of cases that must be re-evaluated, which can result in longer indexing times. When this occurs, a system message appears to notify you that the queue might take additional time to complete.
-
-
Define the queue conditions:
-
Select Add condition and choose from the same case fields available in case filters.
When you include an assignee as a condition in a case queue definition, be careful that the field is appropriate for the value you enter. Use
assignee_namewhen you enter the assignee’s display name, such as a name or email address shown in the UI. Useassigneewhen you enter the assignee’s internal user ID. If you chooseassignee_nameand then enter a user ID, or if you chooseassigneeand then enter a display name, the queue will not return any results because the field and value are mismatched. -
By default, new queues include the condition
status is New OR In Progress OR Escalated. -
You can modify or remove this condition as needed. This default ensures that initial queue results focus on cases that require attention—new, actively investigated, or escalated—so analysts can prioritize triage and response.
-
Use Add inner group to create grouped conditions (inner groups) that act as logical subfilters for more complex matching.
-
You can combine conditions and inner groups with AND/OR/NOT logic.
-
-
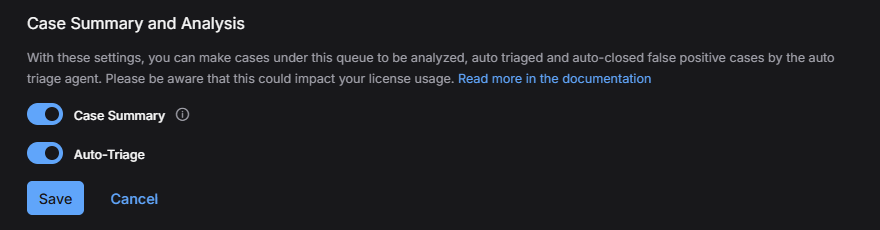
In the Case Summary and Analysis section, choose whether Stellar Cyber performs AI-based analysis for the cases in this queue, and then select Save to add the queue.

-
Case Summary – Turn on this setting to have Stellar Cyber generate an AI case summary when a case enters the queue or changes while it is in the queue. A case summary uses the data already present in the case to generate a concise narrative that helps you quickly understand the case. It does not perform additional investigation or enrich the case with data from external sources. Case summaries are available to all customers with a valid platform license.
-
Auto-Triage – Turn on this setting to have Stellar Cyber also perform Alert Auto Triage on the alerts in the cases in the queue. Unlike case summaries, Alert Auto Triage automatically performs a multi-step investigation that can enrich the existing case data with information from integrated endpoint, identity, and threat intelligence sources. It uses Verdict Signal Checks to evaluate observables and supporting evidence and assigns verdicts to the alerts in the case. The Auto-Triage setting requires the Case Summary setting to be enabled and appears only when you have the Alert Auto Triage add-on license installed or are in an active trial. Turning off Case Summary automatically turns off Auto-Triage.
The Case Summary and Analysis section appears only when a user with Super Admin privileges has enabled the Enable AI Case Analysis & Summary option in System | ORGANIZATION MANAGEMENT | Settings. For details, see AI Case Analysis .
When a case enters the queue, or changes while it is in the queue, Stellar Cyber generates the case summary and, if enabled, performs alert auto-triage. AI-based analysis is subject to daily limits; for details, see Alert Auto Triage.
-
-
Repeat for additional queues as needed, up to the system limit of 20.
To increase this limit, contact Stellar Cyber Customer Success.
-
Wait for the indexing process to complete.
After a queue is created, Stellar Cyber indexes existing cases to identify which ones meet the defined conditions before displaying counts. The indexing process ensures the queue view reflects all eligible cases within the defined time range. When queue conditions are later modified, re-indexing occurs when related case data changes, such as when alerts are added or case attributes are updated. The queue count updates automatically once indexing is finished.
-
Communicate to analysts which queues they should use and their intended purpose.
This is often done through SOC team briefings, documentation, or messaging.
Working with Case Queues
This procedure describes how analysts interact with queues to find, prioritize, and process the cases assigned to them. Following these steps can help analysts reduce distractions, maintain focus, and process their case workload efficiently.
-
On the Cases page, use the left-side panel to view the list of queues.
-
Default queues always appear in the panel and cannot be deleted. They have a fixed date range of the past year:
-
All Open Cases and All Closed Cases – Contain all cases with open and closed statuses, respectively. The Case Summary and Analysis settings are turned off by default for these queues.
-
AI Analysis Queue – Contains cases with a score of 75 or higher or a severity of Critical. The Case Summary and Auto-Triage settings are turned on by default for this queue, so Stellar Cyber automatically analyzes critical cases.
For all default queues, the conditions, tenant scope, and date range are fixed, but you can edit the Case Summary and Analysis settings. For details, see Configuring Case Queues.
-
-
Custom queues appear according to user configuration.
-
-
Pin the queues you use frequently so they appear at the top of your list.
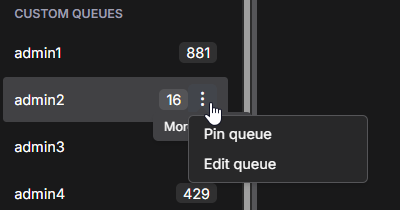
Pins are per-user and do not affect other users.
-
Select a queue to display all cases matching its conditions.
The number shown beside each queue in the side panel is the total number of cases in that queue.
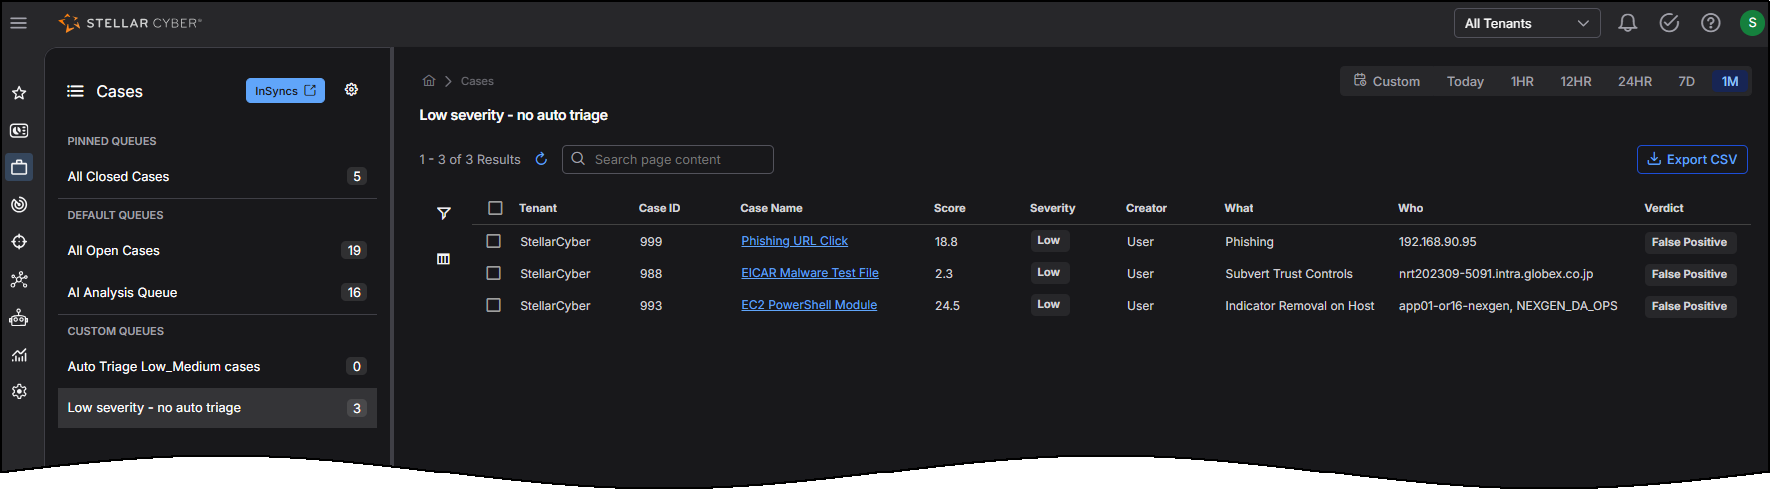
When viewing cases in the queue, you can change the date range used for the cases shown in the table. Standard options include preset ranges such as Today, 1 hour, 12 hours, 24 hours, 7 days, and 1 month. You can also define a custom display range in one of the following ways:
-
Fixed – Specify both a start date and an end date.
-
Since – Specify a start date and display cases from that date through the current date.
-
Last – Specify a number and a unit of time, such as minutes, hours, days, weeks, months, or years, to display cases during this period of time until the present moment.
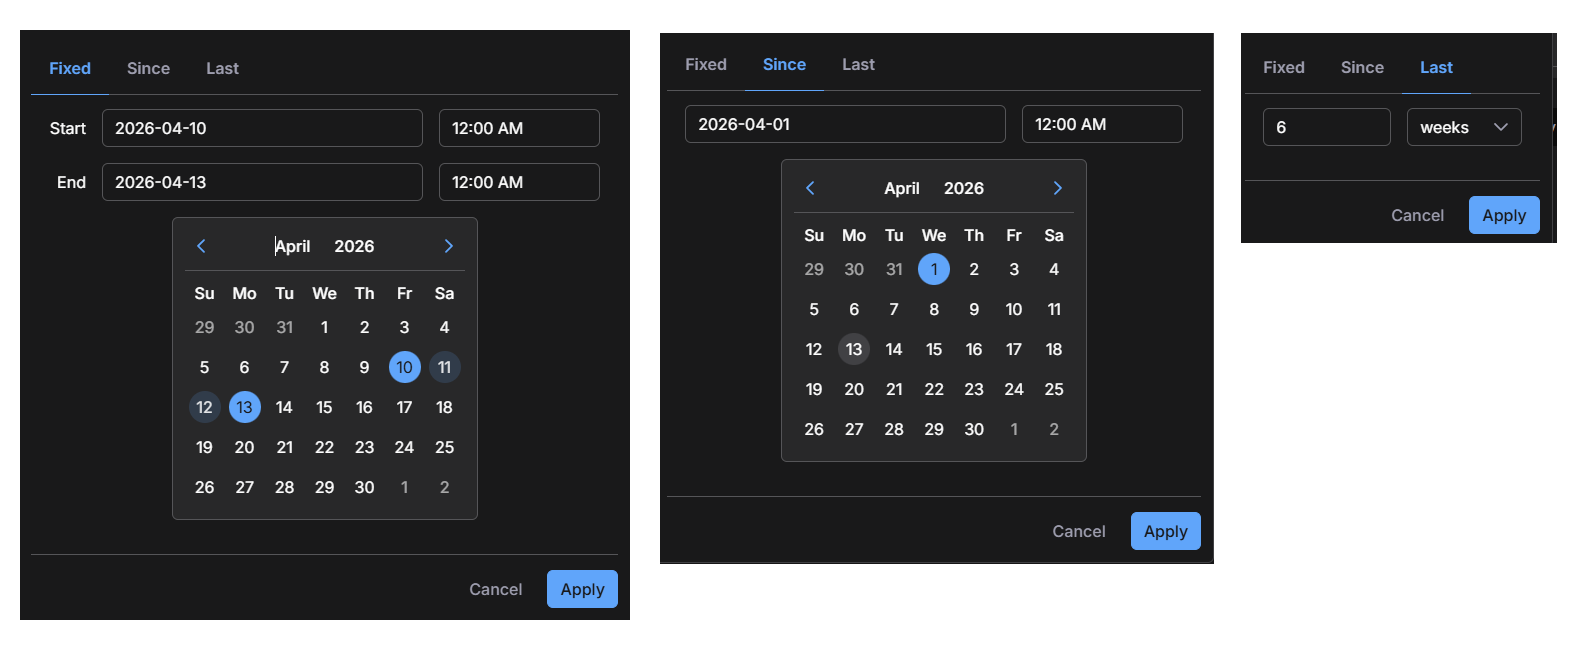
Case names with numbers such as Application Usage Anomaly and 2 others indicate related alerts within the case. The number (for example, 2) is the number of other alerts in the case besides the one shown. Selecting the link opens a filtered case view showing only those related alerts.
If a user modifies a case name, Stellar Cyber no longer updates the name automatically. In this situation, numbers in the case name (such as the count of related alerts) might not match the data shown in the Associated Alerts table.
-
-
Work on cases in order of priority, as determined by score or other operational criteria, and close or resolve them when appropriate.
Additional Information
This section provides supplementary details about how queues behave and which factors might affect what you see when working with them.
-
Identifying Your Queues: You can use pins to focus on your assigned queues.
-
Multi-Match Cases: A case can appear in more than one queue if it matches multiple queue conditions.
-
Performance Limits: Longer date ranges can affect performance when queues include large case sets. If you configure a custom queue with a date range longer than the default (this past week), Stellar Cyber displays a warning so you can decide whether to continue.
-
Case Addition to Queues: Cases are evaluated for inclusion in a custom queue when a case is created or updated. In addition, changing queue conditions causes existing cases in the queue’s configured time range to be checked again for a match.
-
Queues and AI-Based Analysis: When a case enters a queue with the Case Summary or Auto-Triage setting enabled, Stellar Cyber initiates the corresponding AI-based analysis. Queue design therefore determines which cases receive AI-based analysis, in addition to how cases are displayed.
-
Case and Queue Counts: The number beside a queue in the side panel is the total number of cases in that queue. The number of cases in the main table might be smaller because of the required Created At filter. The date range selector in the queue view filters the cases displayed in the table; it does not change the date range used by the queue itself.
Using the Cases Table
Cases matching the selected Case Queue and time range are shown in a sortable Cases table with customizable columns. By default, the All Open Cases queue is selected. The name of the Cases table changes to match the selected Case Queue.
You can select any case to drill to its detail page. You can also use the filters at the left of the table to focus your work on cases that meet specified criteria.
The tabular view lists each case on its own row with the following default columns:
-
Tenant – The tenant with which this case is associated.
-
Case ID – The system-assigned number for the case.
-
Case Name – Stellar Cyber automatically assigns a name to each case it reports. You can either accept the default name or supply your own in the Case Detail view.
-
Score – Stellar Cyber assigns scores to cases based on how critical they are. A case score updates in real time as events and entities are added to or removed from the case. Scores are color-coded to indicate the seriousness of the case.
-
Severity – The severity of a case: Critical (75 and higher), High (50–74), Medium (25–49), or Low (1–24). Severity automatically changes with the case score until it is changed manually in the Case Detail view. Once you manually edit the severity of a case, it no longer updates automatically based on the case score. Severity indicators are color-coded to direct your attention to more serious cases.
-
Creator – The user account that created the case. Cases created by Stellar Cyber are listed with a creator of System.
-
What – The Tactic or Technique for the alert with the highest severity associated with this case.
-
Who – The users and hosts associated with the case. You can find details on the observables for the case in the Analysis tab on the Case Detail page.
-
Assignee – The assignee for the case, if any. Cases can be assigned to resources in the Case Detail view or by selecting the check box for a case at the left of the table and using the bulk edit controls that appear at the top of the table.
You can change the columns in the Cases table using the Column selector described in Changing the Columns in the Cases Table.
Searching the Cases Table
The Cases table includes a Search tool at the top of the display that lets you perform a text-based search using Lucene syntax for a specified value. Keep in mind the following when searching Cases:
-
The data returned by the search is limited to just those entries that pass the current Case filters.
-
The search is performed across all available pages of cases, not just the currently displayed page. For example, if there are three pages of 20 cases available in the Current Cases table, matches can be found on any of the three available pages, regardless of the sort order.
Not All Fields Supported for Searching
Click here to see a list of the fields that are not supported for searching in this release. For these fields, use the entries in the Filter panel (when available) instead.
-
Assignee
-
Tenant
-
Creator
-
Modified By
-
Who
-
What
Filtering the Cases Table 
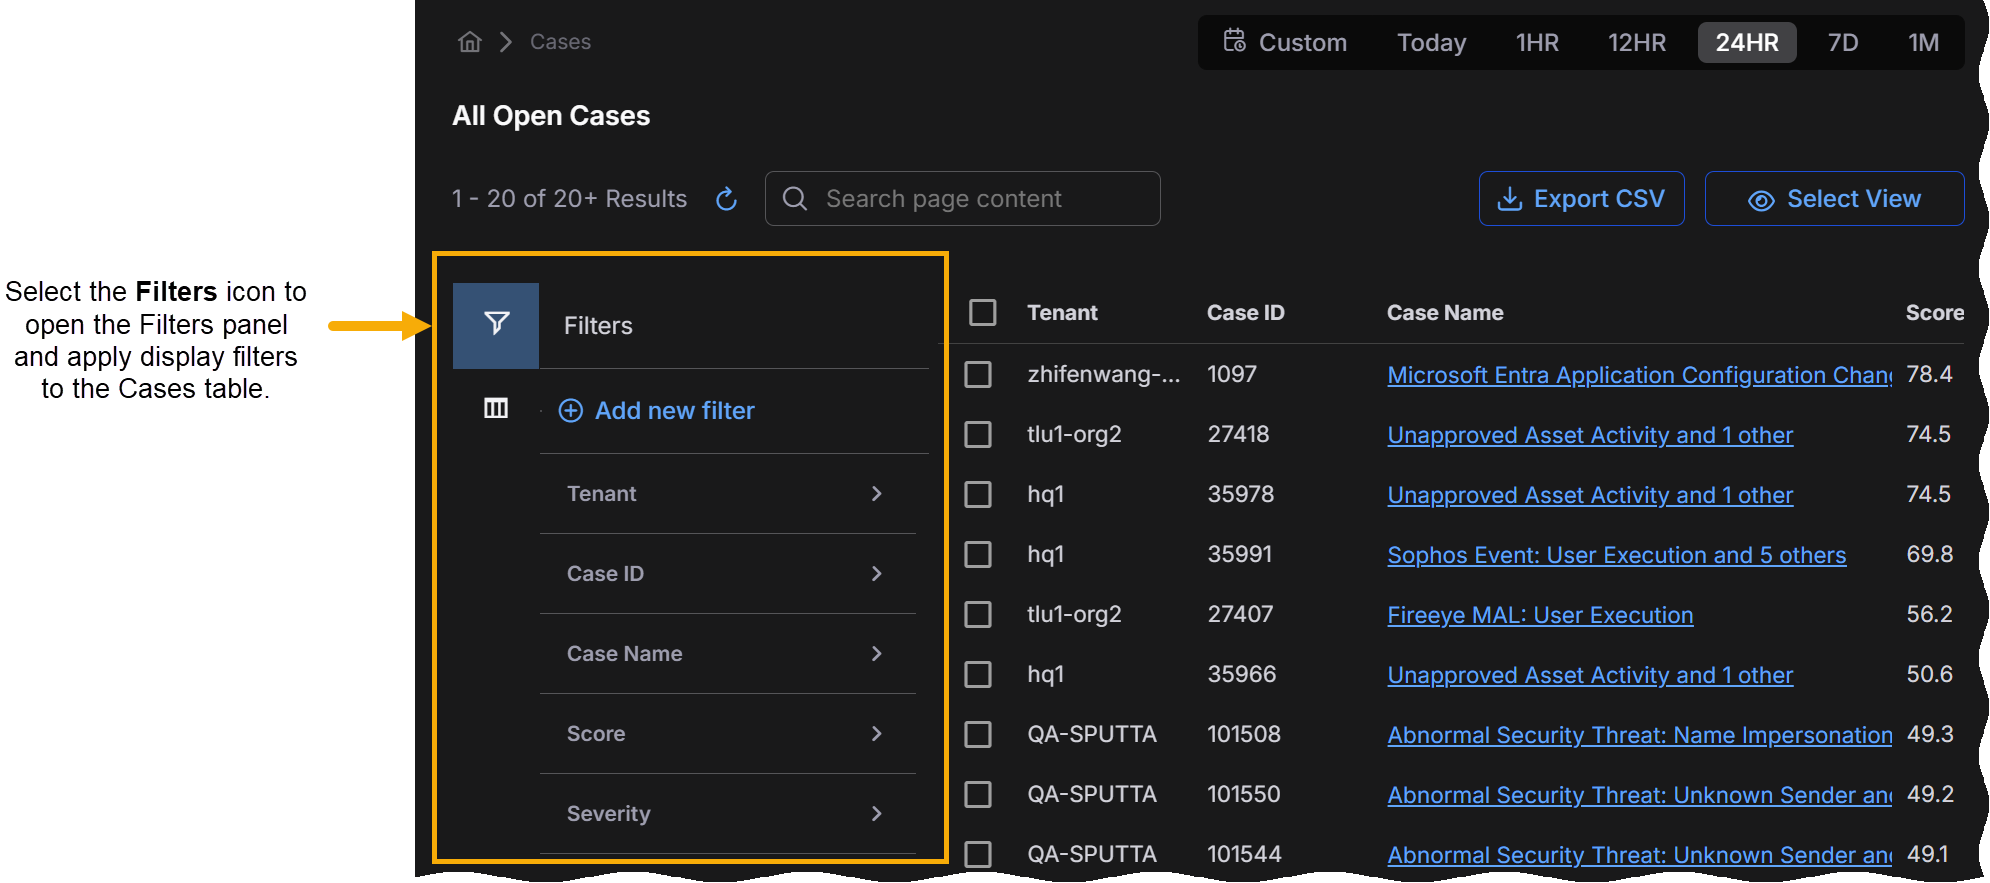
Select the standard Filters icon at the left of the Cases table to open the Filters panel, where you can set display filters that focus the display on just those cases matching the criteria you supply.
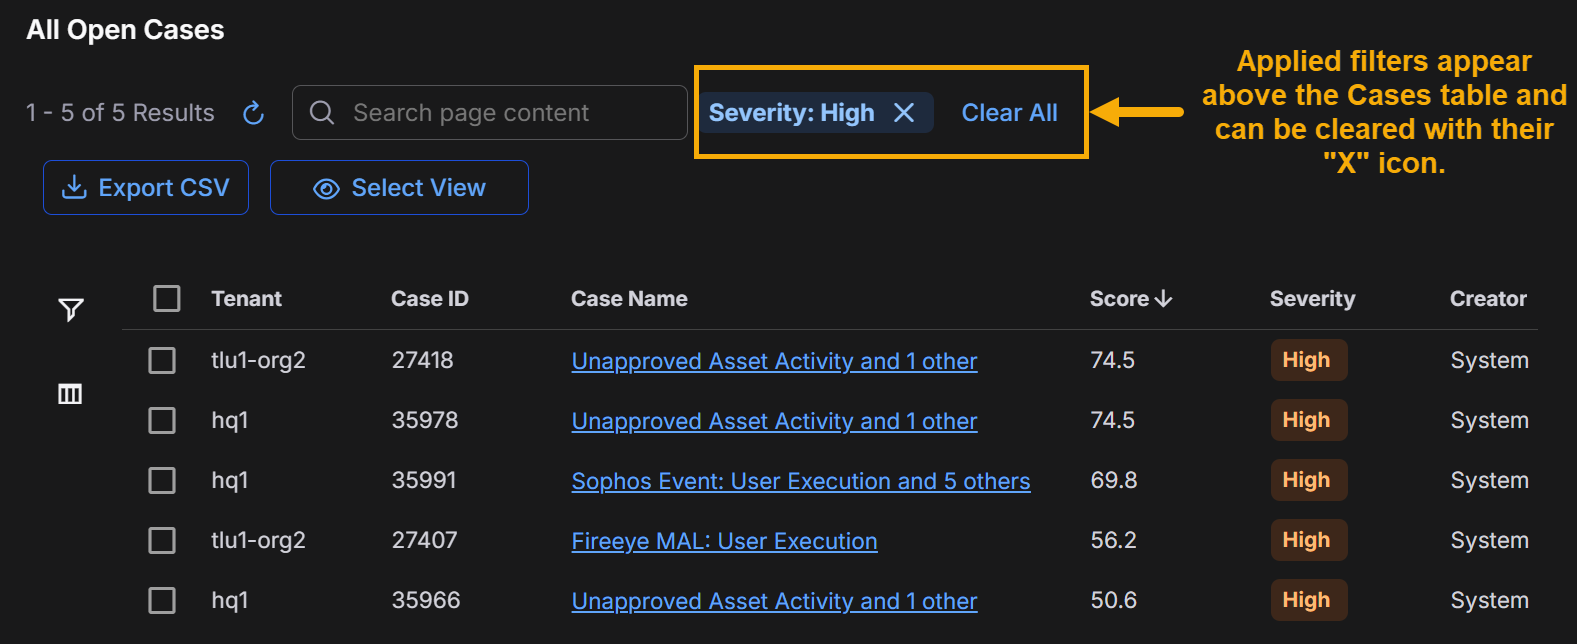
Applied filters are summarized at the top of the Cases table and can be cleared by clicking the X in their entries. You can also use the Clear All button to clear all applied display filters.
Expand this section to learn about the available display filters for the Cases table.
Use the following filters to control the information that's displayed in the Cases table:
-
Tenant – Use the drop-down list to choose the tenants whose cases you want to display.
-
Case ID – Use the Min and Max fields to specify the range of Case IDs to display.
-
Case Name – Supply a case name on which to filter.
-
Score – Use the slider bar to specify the range of case scores from 0-100 to display.
-
Severity – Select one or more case priorities to display (Critical, High, Medium, and Low).
-
Creator – Use the drop-down list to choose the Creators whose cases you want to display.
-
Created At – Use the date controls to specify a range for the creation times of the cases to display.
By default, the Created At filter is automatically set to the last 24 hours. If you select Clear All, the Created At filter resets to the last 24 hours. You can set a range manually if you need a larger range.

-
Modified By – Cases modified by checked user accounts are displayed.
-
Last Modified – Use the date controls to specify a range for the modification dates of the cases to display. Modifications include changes to the alerts, severity, status, comments, or evidence of a case.
The dates you specify for both the Created and Last Modified filters are specified in terms of the browser's local time zone.
-
Size – Use the Min and Max fields to specify the range of case sizes to display. A case's size is the number of alerts associated with the case.
-
Assignee – Start typing in the Search field to see a list of matching user accounts that can be selected as a filter or choose one of the listed users. Users only appear for selection if they have the Edit Cases privilege assigned in Role-Based Access Control and belong to the logged-in tenant. You can select multiple users for the filter.
-
Closed At – Use the date controls to specify a range for the closure times of the cases to display.
-
Acknowledged At – Use the date controls to specify a range for the acknowledgment times of the cases to display.
-
Status – Select one or more case statuses to display: Escalated, New, In Progress, Resolved, and Cancelled.
By default, the Cases page has the Escalated, New, and In Progress Status filters enabled. You can deselect these filters and/or add additional Status filters. However, if you clear all the Status filters, the page automatically enables the default Escalated, New, and In Progress filters again.
-
Resolution – Select one or more case resolutions to display: None, False Positive, Benign, True Positive.
-
Tags – Start typing in the Search field to see a list of matching tags that can be selected as a filter or choose one of the listed tags. You can select multiple tags for the filter.
Changing the Columns in the Cases Table
You can change the columns in the Cases table by selecting the Columns button at the left of the table to toggle open a panel where you can choose the columns to display.
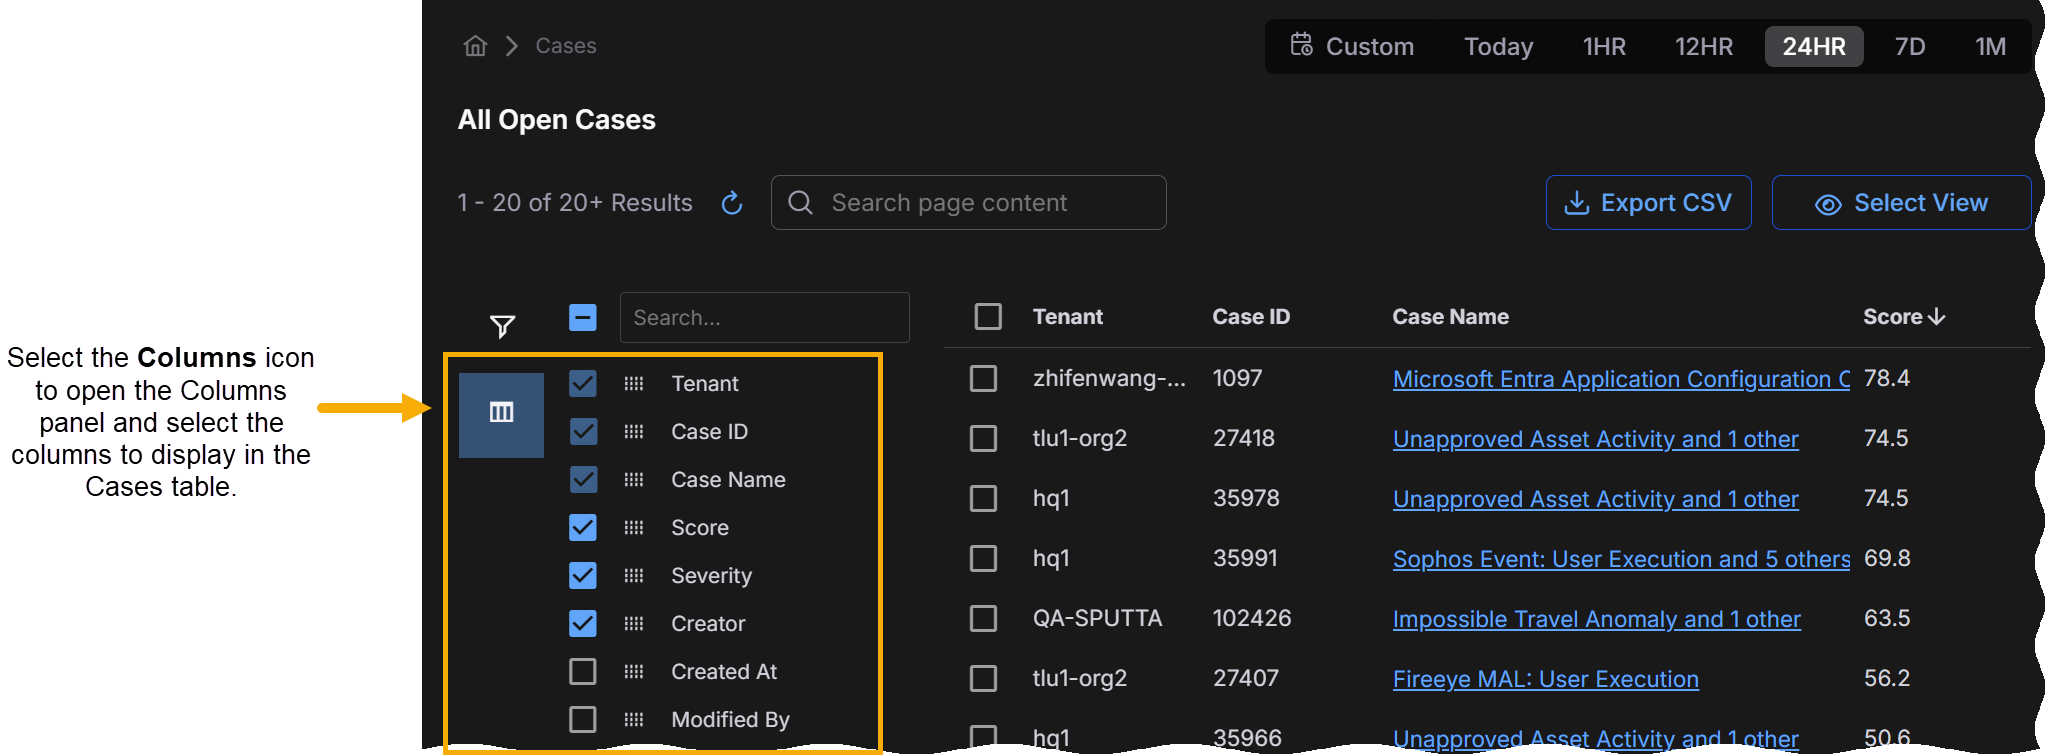
The Tenant, Case ID, and Case Name columns always appear in the Cases table and cannot be hidden. You can select any additional columns you want to include in the table and clear those you don't.
Click here to learn about the available columns for the Cases table.
You can toggle the display of any of the columns listed below by selecting or clearing the corresponding boxes in the Column selector:
-
Case ID – The unique identifier that Stellar Cyber assigns to the case when it is created.
-
Case Name – The name of the case. Stellar Cyber generates the name from the alerts in the case, such as Phishing URL Click or Unapproved Asset Activity and 1 other. Select the case name to open the Case Details view.
-
Verdict – The verdict that Alert Auto Triage assigned to the case, such as True Positive or False Positive. The column is empty for cases that have not been analyzed. You can override a verdict in the Case Details view. For details, see Alert Auto Triage.
-
Score – Stellar Cyber assigns scores to cases based on how critical they are. A case's score updates in real time as events and entities are added to or removed from the case. Scores are color-coded to indicate the seriousness of the case.
-
Severity – The severity of the case (Critical, High, Medium, or Low). Severity automatically changes with a case's score until it is changed manually in the Case Detail view. Once you manually edit a case's severity, it no longer updates automatically based on the case score. Severity indicators are color-coded to direct your attention to more serious cases.
-
Creator – The user account that created the case. Cases created by Stellar Cyber are listed with a creator of System.
-
Created At – The time at which the case was created.
-
Modified By – The user account that last modified the case.
-
Last Modified – The last time the case was modified. A case is considered to have been modified whenever there are changes to its alerts, severity, status, comments, or evidence.
-
What – The Tactic or Technique for the alert with the highest severity associated with this case.
-
Who – The users and hosts associated with the case. You can find details on the observables for the case in the Analysis tab on the Case Detail page.
-
Size – The number of alerts associated with the case.
A case can have a maximum of 5,000 associated alerts.
-
Assignee – The assignee for the case, if any. Cases can be assigned to resources in the Case Detail view or by selecting the check box for a case at the left of the table and using the bulk edit controls that appear at the top of the table.
-
Closed At – The time at which the case was closed. Cases are closed when their status is set to either Resolved or Cancelled.
-
Acknowledged At – The time at which the case was acknowledged. A case is considered acknowledged when a user makes a change to its Severity, Status, or Assignment.
-
Status – The status associated with this case. This can be either New, In Progress, Resolved, Cancelled, or Escalated. Changing the status of a case helps you track your team's response to it over time. You can change a the status in the Case Detail view or by selecting the check box for a case at the left of the table and using the bulk edit controls that appear at the top of the table.
-
Resolution – The resolution given to a case when its status was set to Resolved. Resolutions can be None, False Positive, Benign, or True Positive. The default is None. See Suggested Usage for the Case Resolution Tags for more information on the available resolution tags.
-
Tags – The tags assigned to the case, if any. You can assign tags to a case in the Case Detail view or by selecting the check box for a case at the left of the table and using the bulk edit controls that appear at the top of the table.
-
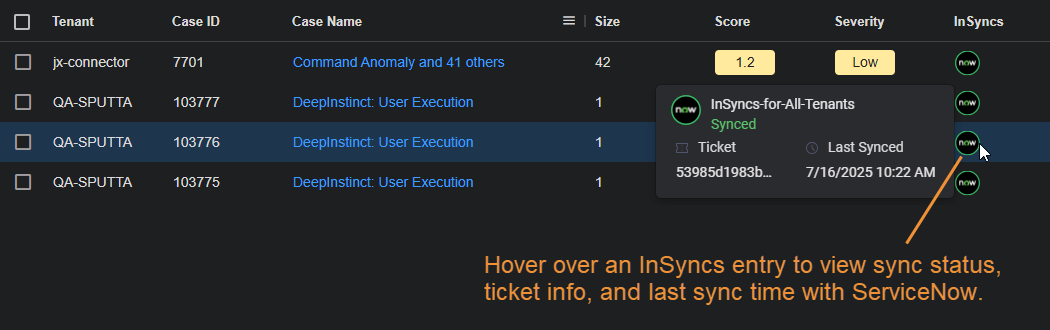
InSyncs
 – For cases that are synchronized with an associated ServiceNow installation using an InSync, you can hover over mouse over the NOW icon in the InSyncs column and see the following information on the synchronization for the case:
-
The name of the InSync performing the synchronization between Stellar Cyber and a third-party application such as ServiceNow.
-
The status of the InSync (Synced, Paused, or Error).
-
The ticket number for the synchronized case in ServiceNow.
-
The last time the case was synchronized, expressed in the time zone of the browser.
-
Not All Columns Support Sorting
Click here to see a list of the columns that are not supported for sorting in this release:
-
Assignee
-
Tenant
-
Creator
-
Modified By
-
Tags
-
Who
-
What
-
InSyncs
Performing Bulk Actions in the Cases Table
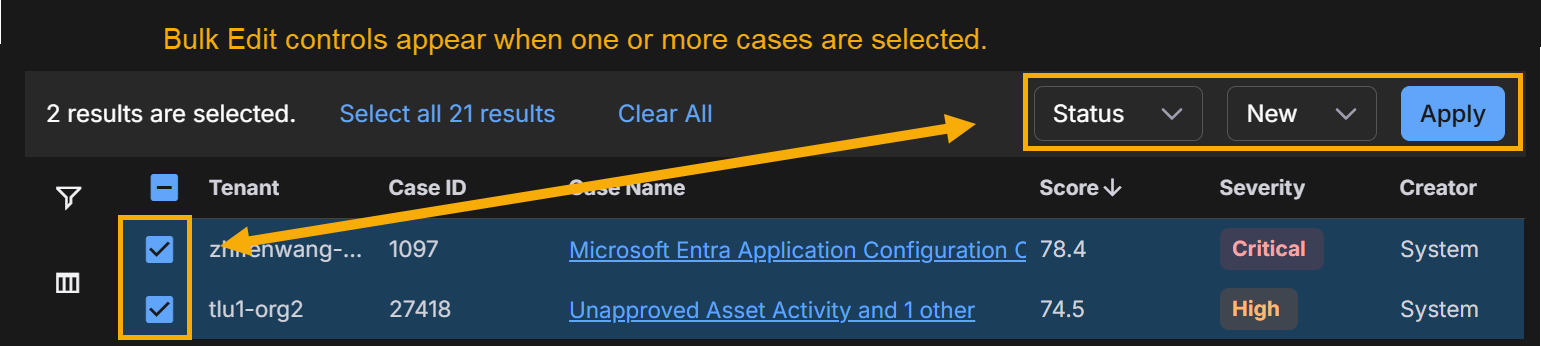
The Cases table supports bulk edits to the Status, Tags, or Assignee of multiple cases. Use the following procedure:
-
Select one or more cases in the Cases table by checking their boxes at the left of the table.
New bulk edit controls appear at the top of the table, as illustrated below:
-
Select the type of bulk action you want to perform from the drop-down lists:
-
Status – The drop-down lets you select any of the standard Case statuses (Escalated, New, In Progress, Resolved, or Cancelled).
Once the status of a case has been changed to either Resolved or Cancelled, Stellar Cyber no longer associates new alerts with it. Instead, new alerts are either used to create a new case or associated with a different open case.
-
Tags – The adjacent dropdown lets you select from any existing tags. You can also type in a new tag.
-
Assignee – The adjacent dropdown lets you select any existing user available to your tenancy.
-
-
Select Apply to apply your bulk action to the selected cases.
Keeping Track of Bulk Actions
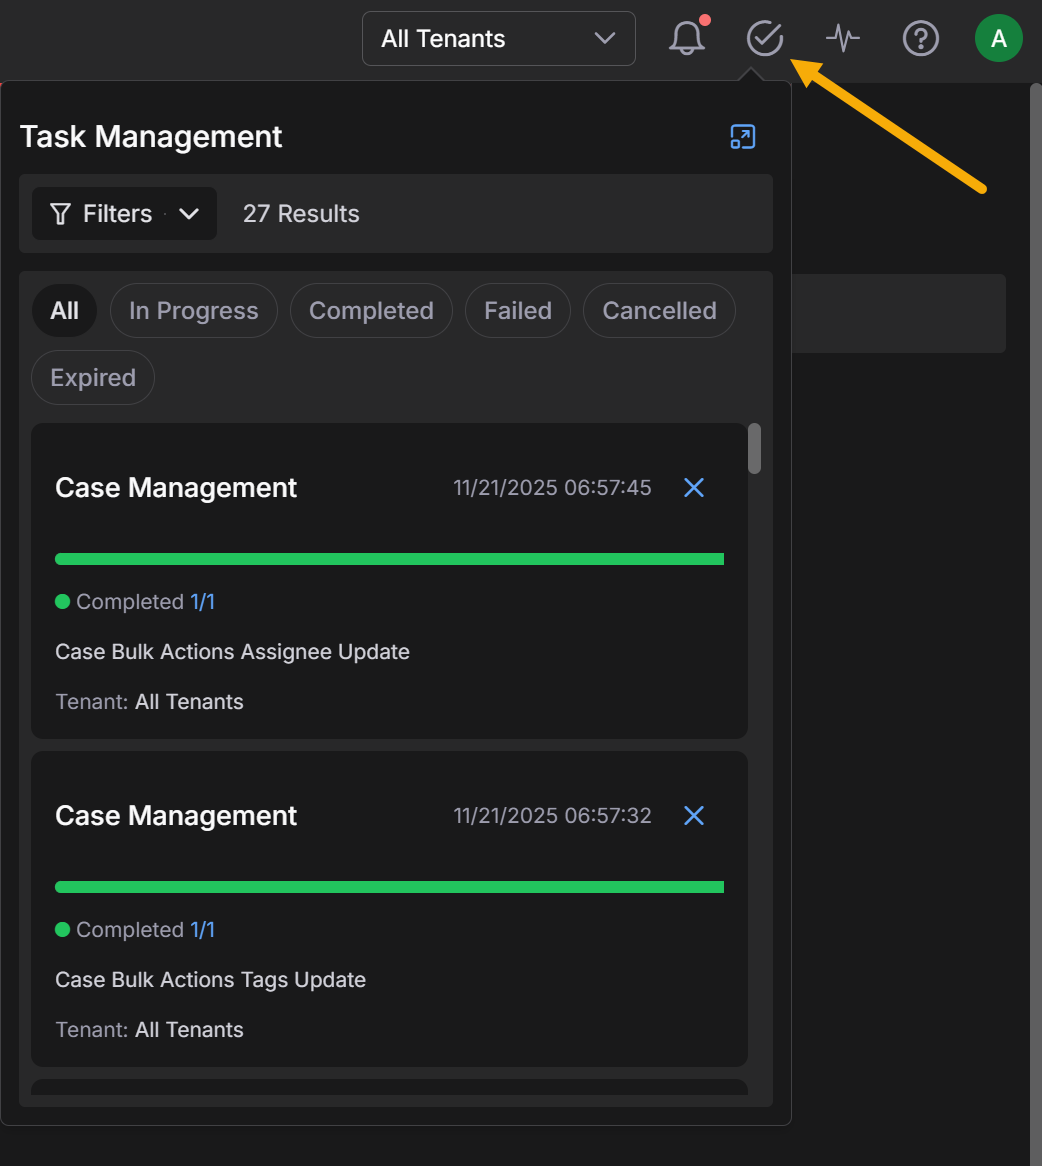
Once you apply a bulk action to one or more cases, Stellar Cyber displays a success or failure message at the top of the display and keeps track of its progress in the Task List.
Here's an example of a Bulk Action that was successfully applied:

You can display the Task List using its icon at the top of the display, as illustrated below. The Task List keeps track of the progress, success, or failure of any bulk actions performed from the Current Cases table, as well as any other ongoing Stellar Cyber activities. Depending on the number of cases affected by a bulk action, it make take a few seconds for the action to complete. The Task List is useful in these situations, letting you see the progress of the action. Here's how you display the Task List, complete with some successful bulk actions:
You can clear individual tasks from the list using the standard close button at the upper right of their entries in the list. Clear all of the tasks using the Clear all link at the top of the list.
Standard Functionality in the Cases Table
The Cases table offers standard table functionality, including the ability to sort on a column, pin columns, autosize columns, reset column sizes, Export as CSV, or Change Columns.
Configuring Case Settings
Users with a root user scope and RBAC privileges that let them change user interface settings (for example, users assigned the default Super Admin role or a custom role with equivalent privileges) can select the Settings  icon at the top of the Case Queues panel to access the following tabs:
-
Case Properties – Set alert closure options.
-
Correlation – Configure case correlation behavior.
-
Case Filters – Configure case suppression logic to determine which cases are created.
-
Queues – Configure customizable case queues that use detailed filter criteria to display cases specific to different roles, departments, workflows.
-
Metrics – Configure case metrics to track the time of various case operations such as the acknowledgement of a case assignment, the action taken in response, and its resolution.
Changes made on these tabs apply globally to all cases.
Users without these privileges (such as users assigned the default Platform Admin role or a custom role with equivalent privileges) can still open Case Settings and configure the Case Filters and Queues tabs, but the Case Properties and Correlation tabs are not available.
Setting Case Properties
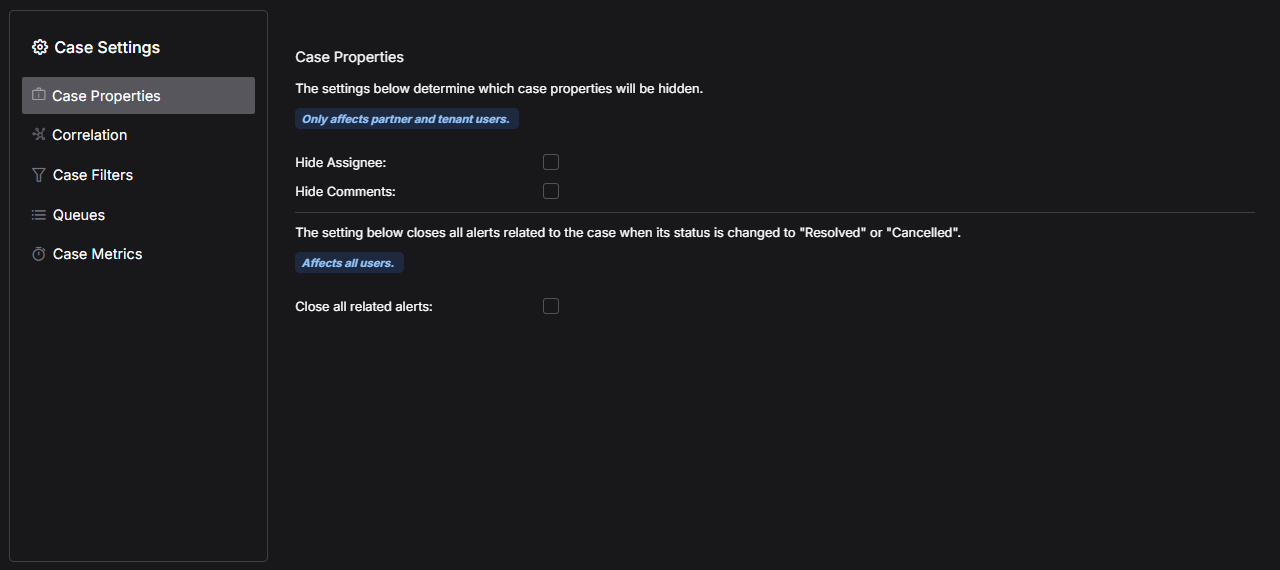
Use the Case Properties settings to control which case elements are visible to partner and tenant users and whether related alerts are automatically closed when a case is resolved or cancelled. These settings apply globally and are only available to users with root scope.
Hide Assignee/Hide Comments
The Hide Assignee and Hide Comments options let root users specify whether partner and tenant users can see case assignees and comments:
-
Hide Assignee – Hide case assignees from partner and tenant users.
-
Hide Comments – Hide case comments from partner and tenant users.
Users with root scope can still see case assignees and comments regardless of the settings of these options.
Close All Related Alerts 
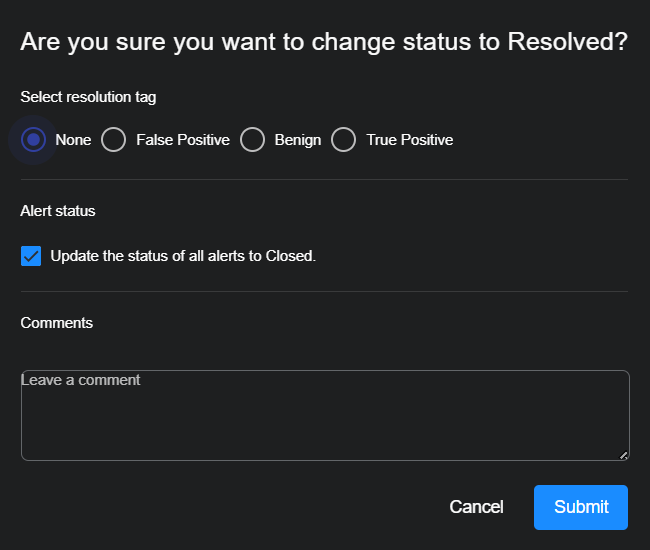
This option specifies whether all alerts related to a case are closed by default when the parent case's status changes to either Resolved or Cancelled. Alerts in cases closed through the API or InSyncs are also closed automatically when this option is enabled. This option is enabled by default.
You can override this default setting for individual cases in the confirmation dialog box that appears when cancelling or resolving a case. The Update the status of all alerts to Closed option is automatically set according to whatever you specify for this global default, but you can reverse the setting in the confirmation dialog for an individual case, as illustrated below:
Setting Correlation Options
The Correlation tab lets you configure the following options:
Setting the Correlation Timeout
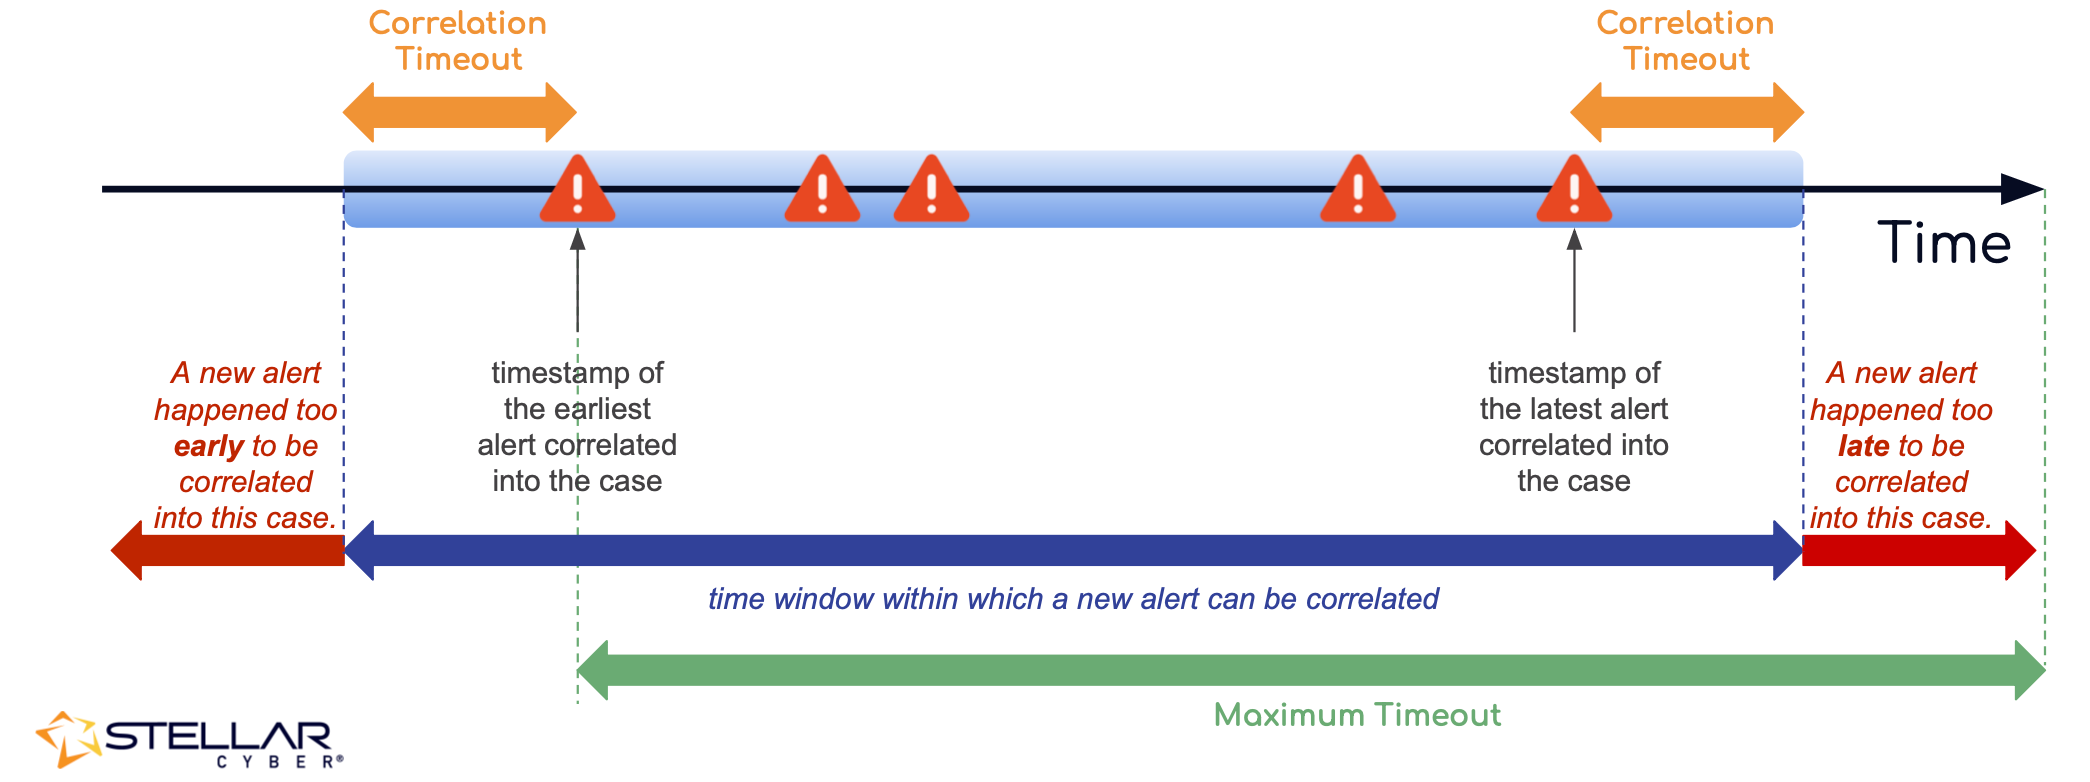
The Correlation tab let you set a global Correlation Timeout for your organization. The Correlation Timeout specifies the time window within which new alerts are considered for correlation into both new and currently open cases.
An alert can be correlated into an existing case if its timestamp falls within a specific time window of the case. Correlation uses the timestamp of the alert (the time the event occurred), not the time when Stellar Cyber received or processed the underlying log. The time window is determined by the Correlation Timeout, which is the amount of time after the latest alert in the case or before its earliest alert. The figure below illustrates how this works:
Each case tracks two values:
-
start_timestamp– The earliest alert timestamp in the case. -
end_timestamp– The latest alert timestamp in the case.
A new alert for the same entity is not correlated into the case if any of the following is true:
-
Too late – Its timestamp is more than the Correlation Timeout after the
end_timestampof the case. -
Too early – Its timestamp is more than the Correlation Timeout before the
start_timestampof the case. -
Too long – Adding it would make the case span more than 30 days.
The default Correlation Timeout is three hours; the maximum is 24 hours. A larger timeout allows alerts that are further apart in time to correlate, but it also produces larger cases.
Use the drop-down lists to specify the Correlation Timeout for your organization in hours and minutes. The user interface does not let you specify a value greater than 24 hours. You can always use the Reset to default option to restore the default value.
Changes to the Correlation Timeout apply only to open and new cases. Closed cases are not updated with additional alerts based on a change to the Correlation Timeout. However, it is possible that a change to the Correlation Timeout can result in additional alerts being correlated to an open case that took place before the previously reported earliest alert.
Refer to Understanding Cases for a detailed discussion of how cases are created and correlated.
Adjusting the Maximum Alerts per Case 
Only root users with the privilege to edit Settings can change this value. The change applies globally to all system-created cases.
The Alerts Per Case setting lets you define the maximum number of alerts that can be grouped into a single case. By default, the value is set to 5,000 alerts, but you can adjust the limit anywhere between 1 and 5,000.
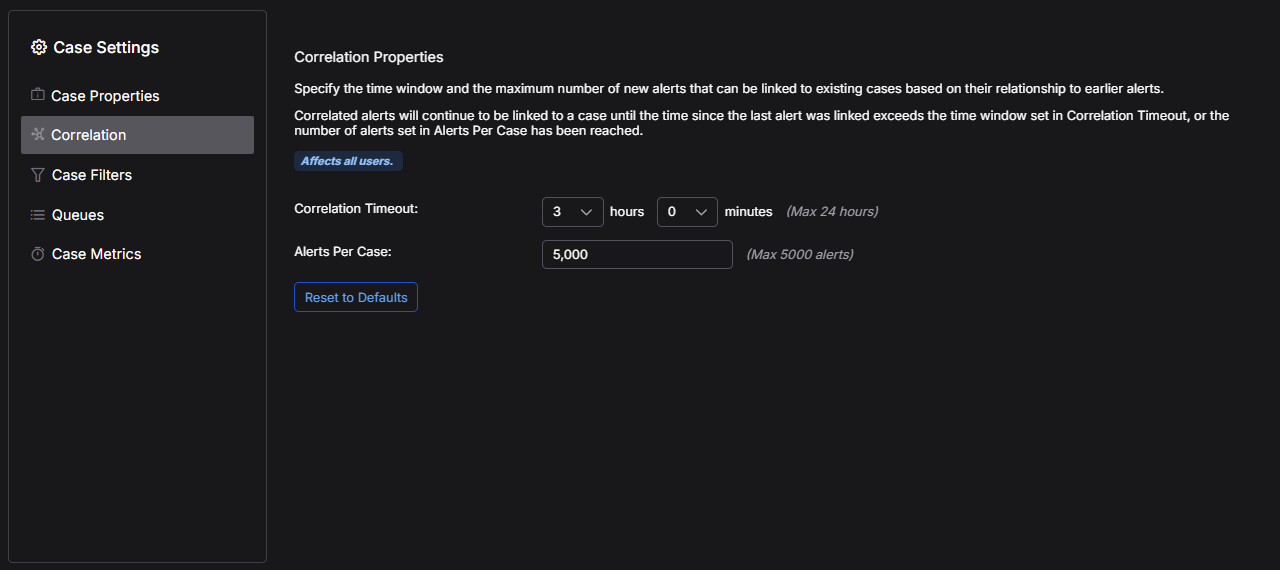
When the specified maximum is reached, additional alerts that would normally be added to the case are instead placed in a new case. This prevents individual cases from becoming too large and consuming unnecessary computation resources.
Changing this value can help you balance case manageability with correlation accuracy:
-
Lowering the value breaks up large cases into smaller ones, improving performance and making them easier to investigate. This is especially useful in environments with noisy alerts, such as custom ATH detections.
Be cautious when reducing the maximum. If the value is set too low, related alerts may be split across multiple cases, which can obscure the full context of an incident.
-
Raising the value allows more alerts to be grouped together, preserving context across a large attack campaign, but can result in slower performance and more difficult case triage.
When you change the Alerts Per Case setting, the new maximum takes effect immediately. The new alert-per-case maximum only applies to cases going forward, so that any existing cases that exceed the new maximum remain unaffected by the change. For example, if there is an existing case with 4,500 alerts and you change the maximum to 4,000 alerts per case, this case continues to hold 4,500 alerts, even though it exceeds the new maximum. However, any new alerts that would otherwise have gone into this case are placed in a new case instead.
Configuring Case Filters 
You can use case filters to control the automatic creation of cases by defining specific conditions under which Stellar Cyber suppresses their creation. Instead of generating a case for every group of related alerts, you can use case filters to prevent the creation of cases that are low risk, expected, or otherwise unimportant. This reduces case volume and helps you focus attention and resources on the alerts that matter most. This targeted suppression allows your team to maintain a streamlined, relevant case queue and reduce alert fatigue.
In the Case Settings section, you can create new filters, edit existing ones, or delete filters that are no longer needed. For detailed information about case filters, see Using Case Filters and the Filter Builder.
Configuring Case Metrics
Case metrics let you measure how long case operations take. Each metric is a timer that Stellar Cyber starts, pauses, and stops based on conditions you define, such as the time from case creation to acknowledgment by an analyst, or the total time from creation to resolution. You can then use these metrics to measure the response times of your SOC team against operational targets you track outside the Stellar Cyber Platform
Stellar Cyber applies every enabled metric automatically to all cases for all tenants, so you don't have to attach metrics to cases individually.
Creating a Case Metric
A new deployment starts with no metrics configured. Use the following procedure to create one.
-
In the Case Metrics tab, select + Create.
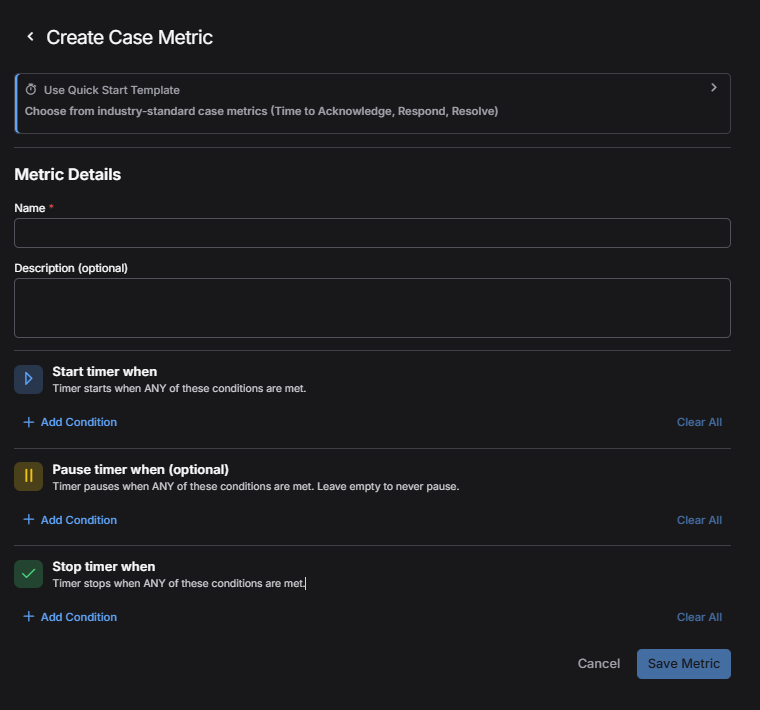
The Create Case Metric dialog box appears.
-
Under Metric Details, enter a Name for the metric and, optionally, a Description.
Because the name appears as a column heading in the Cases table, it's advisable to keep it short.
Metric names must be unique. If you enter a name already in use, Stellar Cyber displays an error and you cannot save the metric until you change it.
-
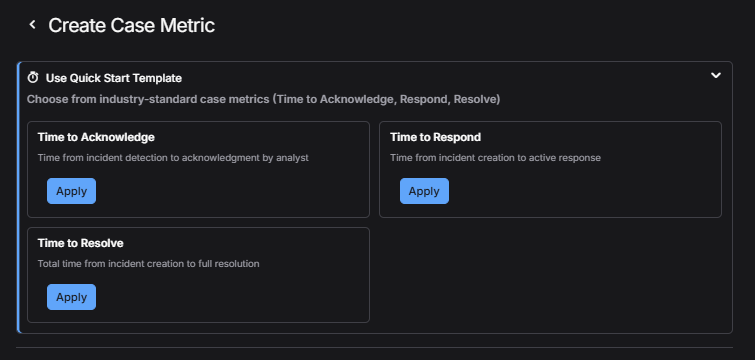
To define the condition for triggering timers, either use one or more of Quick Start Templates or configure custom settings.
To use templates, expand Use Quick Start Template and select Applyfor Time to Acknowledge, Time to Respond, or Time to Resolve.
Applying a template fills in the name, description, and timer conditions with values that you can modify.
-
To configure custom metrics, define one or more conditions that trigger the timer.
Each metric requires start and stop conditions; pause conditions are optional.
-
Start timer when – The timer starts when any of its conditions are met.
-
Pause timer when (optional) – The timer pauses when any of these conditions are met. Leave this section empty if the timer should never pause.
-
Stop timer when – The timer stops when any of these conditions are met.
A paused timer resumes when a start condition is met again. Because some conditions can occur only once, consider this behavior when you pair pause conditions with start conditions. A timer that starts on Case Created would never resume after it pauses, as a case is created only once. A timer that starts on Case Assigned, or on a case field such as Status, can resume whenever that condition is met again.
Select Add Condition in a section and choose a Field. Fields are grouped into events and case fields.
Events describe something that happens to a case. An event either occurs or it does not, so it requires no operator or value. Selecting the event completes the condition. The available events are:
-
Case Assigned – An assignee is set for the case.
-
Case Closed – The case is closed.
-
Case Created – The case is created.
-
Case Reopened – The status of the case changes from a closed status to an open status.
-
Case Unassigned – The assignee is removed from the case.
-
Comment Added – A comment is added to the case.
-
Response Action Initiated – A response action is triggered on the case.
Case Fields describe an attribute stored on the case. After choosing a case field, select an Operator and enter the value to compare against. The available case fields are Assignee, Created By, Modified By, Name, Resolution, Score, Severity, Size, Status, Tags, Tenant ID, and Ticket ID.
The numeric fields Score, Size, and Ticket ID support is, is not, greater than, greater than or equal to, less than, less than or equal to, and in range. All other case fields support is and is not. The is and is not operators accept multiple values, and the condition is met when the field matches any of them. The in range operator provides From and To fields.
Conditions within a section combine with OR logic, which means that the timer responds as soon as any single condition is met. Select Clear All to remove all conditions from a section.
-
-
Select Save Metric.
New metrics are enabled by default. You can have a maximum of 10 case metrics, counting both enabled and disabled metrics. When you reach the limit, the Create option becomes unavailable. To add another metric at this point, you must delete one you no longer need.
To increase this limit, contact Stellar Cyber Customer Success.
Managing Case Metrics
The Case Metrics tab lists each configured metric with its name, description, status, and available actions. Use the toggle in the Actions column to enable or disable a metric without deleting it, the Edit icon to modify it, and the Trash icon to delete it.
Selecting the Edit icon opens the Edit Case Metric dialog box, which provides the same fields as the Create Case Metric dialog box. Change the name, description, or any timer condition, and then select Update Metric.
The Use Quick Start Template option also appears in the Edit Case Metric dialog box. Applying a template replaces every value currently in the dialog box, including timer conditions you have already defined, and clears any section the template does not define. If you apply a template to an existing metric unintentionally, select Cancel rather than Update Metric.
Viewing Case Metrics
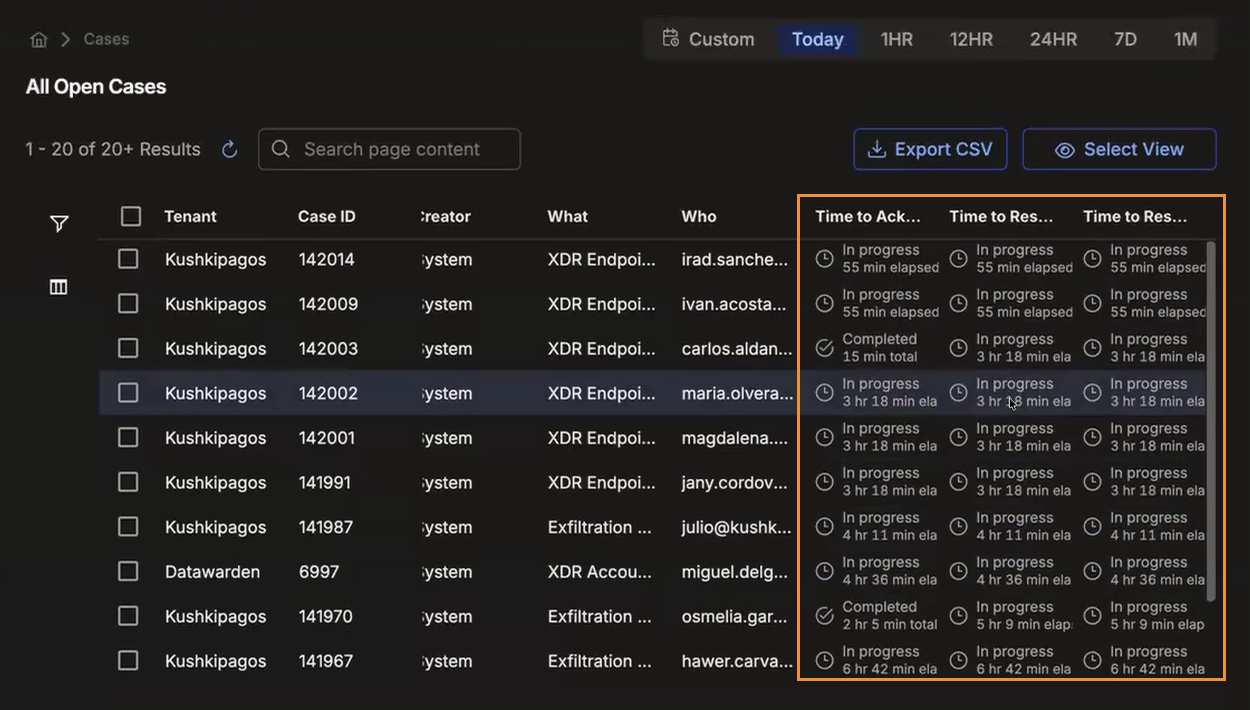
Each enabled metric is available as a column in the Cases table, hidden by default. To display a metric, open the column chooser and select it. Each cell shows the timer state and the corresponding duration: Not Started; In progress, with the time elapsed since the timer started; Paused, with the duration reached when the timer paused; or Completed, with the total duration. Durations appear in minutes, hours and minutes, or days and hours, depending on length.
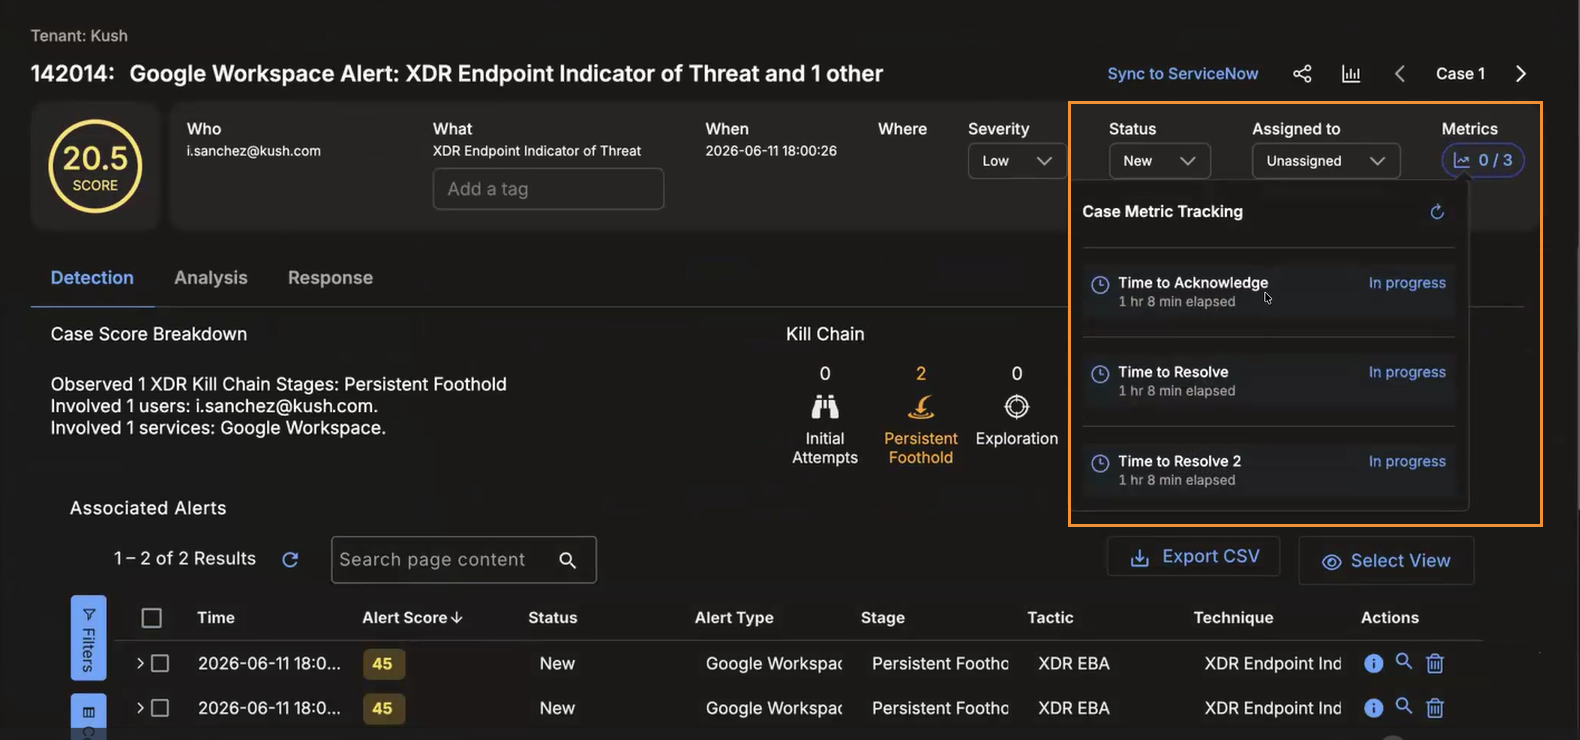
The header of the Case Detail page includes a Metrics indicator showing how many of the metrics that apply to the case have completed, such as 0 / 3. Select the indicator to open the Case Metric Tracking panel, which lists each metric that applies to the case with its state and elapsed time. Select the refresh icon at the top of the panel to update the values.
Drilling to the Case Detail Page
You can select a case entry in the Cases table to drill to the Case Detail view for the corresponding Case.
Displaying Cases from Event Details
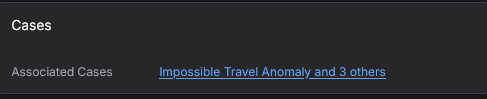
In addition to accessing the Cases table from the Cases menu, you can also display a filtered Cases table from the Cases list in the Event Details view for an alert.
The Cases list shows cases associated with the selected alert in descending order by score, up to a maximum of five. You can select the View All (x) link at the upper right of the list to open a new tab with a filtered view of the Case summary page showing just those cases associated with the selected alert. You can also select the entry for an individual case in the list to open its associated Case details page. The figure below shows the Cases list from the Event Details view of an alert: